- Power BI forums
- Updates
- News & Announcements
- Get Help with Power BI
- Desktop
- Service
- Report Server
- Power Query
- Mobile Apps
- Developer
- DAX Commands and Tips
- Custom Visuals Development Discussion
- Health and Life Sciences
- Power BI Spanish forums
- Translated Spanish Desktop
- Power Platform Integration - Better Together!
- Power Platform Integrations (Read-only)
- Power Platform and Dynamics 365 Integrations (Read-only)
- Training and Consulting
- Instructor Led Training
- Dashboard in a Day for Women, by Women
- Galleries
- Community Connections & How-To Videos
- COVID-19 Data Stories Gallery
- Themes Gallery
- Data Stories Gallery
- R Script Showcase
- Webinars and Video Gallery
- Quick Measures Gallery
- 2021 MSBizAppsSummit Gallery
- 2020 MSBizAppsSummit Gallery
- 2019 MSBizAppsSummit Gallery
- Events
- Ideas
- Custom Visuals Ideas
- Issues
- Issues
- Events
- Upcoming Events
- Community Blog
- Power BI Community Blog
- Custom Visuals Community Blog
- Community Support
- Community Accounts & Registration
- Using the Community
- Community Feedback
Register now to learn Fabric in free live sessions led by the best Microsoft experts. From Apr 16 to May 9, in English and Spanish.
- Power BI forums
- Forums
- Get Help with Power BI
- Desktop
- Order by Chart by Category and Product
- Subscribe to RSS Feed
- Mark Topic as New
- Mark Topic as Read
- Float this Topic for Current User
- Bookmark
- Subscribe
- Printer Friendly Page
- Mark as New
- Bookmark
- Subscribe
- Mute
- Subscribe to RSS Feed
- Permalink
- Report Inappropriate Content
Order by Chart by Category and Product
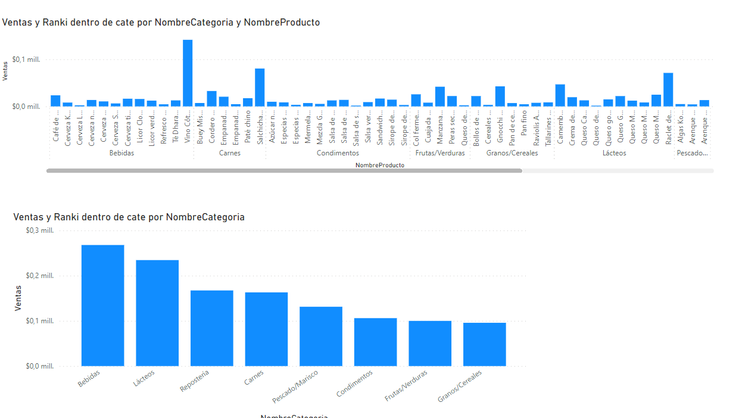
I have tried to sort the products by the “Ventas” measure but within the category but I have not been able to stay as shown in the first graph I would like to achieve the ordered result of the second graph but within each category. I created a measure to sort if well in a matrix shows what is desired not in a graph.
He intentado ordenar los productos por la medida de “Ventas” pero dentro de la categoría, sin embargo, no he podido mantenerlo como se muestra en el primer gráfico. Me gustaría lograr el resultado ordenado del segundo gráfico pero dentro de cada categoría. Creé una medida para ordenar si bien en una matriz muestra lo que se desea, no en un gráfico.
Rank dentro de cate = if(ISINSCOPE(Productos[NombreProducto]),IF(ISBLANK([Ventas]),BLANK(),
RANKX(ALLSELECTED(Productos[NombreProducto]),[Ventas],,DESC,Dense)), BLANK())
My goal is like this :
https://drive.google.com/file/d/1R_q-q4dm-_zlCKaUixGNwtjIeOVbXXe-/view?usp=sharing
Solved! Go to Solution.
- Mark as New
- Bookmark
- Subscribe
- Mute
- Subscribe to RSS Feed
- Permalink
- Report Inappropriate Content
Hi,
You do not need the Rank measure. I switched to a Table visual and sorted by the Product column in ascending order and then by the Vestas field in descending order. I then switched back to the Clustered Column chart visual. PBi file attached.
Hope this helps.
Regards,
Ashish Mathur
http://www.ashishmathur.com
https://www.linkedin.com/in/excelenthusiasts/
- Mark as New
- Bookmark
- Subscribe
- Mute
- Subscribe to RSS Feed
- Permalink
- Report Inappropriate Content
Thank you Sr. your the best
- Mark as New
- Bookmark
- Subscribe
- Mute
- Subscribe to RSS Feed
- Permalink
- Report Inappropriate Content
You are welcome.
Regards,
Ashish Mathur
http://www.ashishmathur.com
https://www.linkedin.com/in/excelenthusiasts/
- Mark as New
- Bookmark
- Subscribe
- Mute
- Subscribe to RSS Feed
- Permalink
- Report Inappropriate Content
Please provide sample data that covers your issue or question completely, in a usable format (not as a screenshot).
Do not include sensitive information or anything not related to the issue or question.
If you are unsure how to upload data please refer to https://community.fabric.microsoft.com/t5/Community-Blog/How-to-provide-sample-data-in-the-Power-BI-...
Please show the expected outcome based on the sample data you provided.
Want faster answers? https://community.fabric.microsoft.com/t5/Desktop/How-to-Get-Your-Question-Answered-Quickly/m-p/1447...
Helpful resources

Microsoft Fabric Learn Together
Covering the world! 9:00-10:30 AM Sydney, 4:00-5:30 PM CET (Paris/Berlin), 7:00-8:30 PM Mexico City

Power BI Monthly Update - April 2024
Check out the April 2024 Power BI update to learn about new features.

| User | Count |
|---|---|
| 109 | |
| 101 | |
| 75 | |
| 63 | |
| 62 |
| User | Count |
|---|---|
| 141 | |
| 104 | |
| 101 | |
| 80 | |
| 67 |


