- Power BI forums
- Updates
- News & Announcements
- Get Help with Power BI
- Desktop
- Service
- Report Server
- Power Query
- Mobile Apps
- Developer
- DAX Commands and Tips
- Custom Visuals Development Discussion
- Health and Life Sciences
- Power BI Spanish forums
- Translated Spanish Desktop
- Power Platform Integration - Better Together!
- Power Platform Integrations (Read-only)
- Power Platform and Dynamics 365 Integrations (Read-only)
- Training and Consulting
- Instructor Led Training
- Dashboard in a Day for Women, by Women
- Galleries
- Community Connections & How-To Videos
- COVID-19 Data Stories Gallery
- Themes Gallery
- Data Stories Gallery
- R Script Showcase
- Webinars and Video Gallery
- Quick Measures Gallery
- 2021 MSBizAppsSummit Gallery
- 2020 MSBizAppsSummit Gallery
- 2019 MSBizAppsSummit Gallery
- Events
- Ideas
- Custom Visuals Ideas
- Issues
- Issues
- Events
- Upcoming Events
- Community Blog
- Power BI Community Blog
- Custom Visuals Community Blog
- Community Support
- Community Accounts & Registration
- Using the Community
- Community Feedback
Register now to learn Fabric in free live sessions led by the best Microsoft experts. From Apr 16 to May 9, in English and Spanish.
- Power BI forums
- Forums
- Get Help with Power BI
- Desktop
- Matrix add each total for each Value in row
- Subscribe to RSS Feed
- Mark Topic as New
- Mark Topic as Read
- Float this Topic for Current User
- Bookmark
- Subscribe
- Printer Friendly Page
- Mark as New
- Bookmark
- Subscribe
- Mute
- Subscribe to RSS Feed
- Permalink
- Report Inappropriate Content
Matrix add each total for each Value in row
Hi all,
I am trying to get the SUM of each value of rows but I have no idea on how to do it.
Example for what I have :
Example for what I wish :
Thank you for you help
Solved! Go to Solution.
- Mark as New
- Bookmark
- Subscribe
- Mute
- Subscribe to RSS Feed
- Permalink
- Report Inappropriate Content
Hello! Create an explicit measure for SL an TN (Basically, take whatever measure you have for the values now and create two more - one that is based on it being filtered to SL and one for TN:

Here is one I did with some sample data to show how it would look:

Proud to be a Super User! |  |
- Mark as New
- Bookmark
- Subscribe
- Mute
- Subscribe to RSS Feed
- Permalink
- Report Inappropriate Content
@audreygerred How about add each total for each Value in sub column instead of row, i want adding total of "SAN_LUONG","TIEN_NUOC" below total col?
- Mark as New
- Bookmark
- Subscribe
- Mute
- Subscribe to RSS Feed
- Permalink
- Report Inappropriate Content
Hello! Are "SAN_LUONG","TIEN_NUOC" separate measures in your model or is it one measure that is categorized by a dimension field?
Proud to be a Super User! |  |
- Mark as New
- Bookmark
- Subscribe
- Mute
- Subscribe to RSS Feed
- Permalink
- Report Inappropriate Content
@audreygerred i did it but now i have new problem
as you see the bold number below is calucate by TIEN_NUOC/SAN_LUONG,
and SL_DHN is the columns to show for each row not depence by A, B columns
any idea for that problem Thanks you
- Mark as New
- Bookmark
- Subscribe
- Mute
- Subscribe to RSS Feed
- Permalink
- Report Inappropriate Content
Hi @audreygerred , in that formula,
What needs to be provided for [YourMeasure]
Thanks you.
- Mark as New
- Bookmark
- Subscribe
- Mute
- Subscribe to RSS Feed
- Permalink
- Report Inappropriate Content
Whatever measure you have in place that gets you these values in your chart (I am assuming it is a sum of a field in your table). If you don't have this base measure yet, create that, then create the SL and TN measures that will use it.
Proud to be a Super User! |  |
- Mark as New
- Bookmark
- Subscribe
- Mute
- Subscribe to RSS Feed
- Permalink
- Report Inappropriate Content
thanks you, that working!
- Mark as New
- Bookmark
- Subscribe
- Mute
- Subscribe to RSS Feed
- Permalink
- Report Inappropriate Content
Awesome! Happy I could help!
Proud to be a Super User! |  |
- Mark as New
- Bookmark
- Subscribe
- Mute
- Subscribe to RSS Feed
- Permalink
- Report Inappropriate Content
Hello! Create an explicit measure for SL an TN (Basically, take whatever measure you have for the values now and create two more - one that is based on it being filtered to SL and one for TN:

Here is one I did with some sample data to show how it would look:

Proud to be a Super User! |  |
- Mark as New
- Bookmark
- Subscribe
- Mute
- Subscribe to RSS Feed
- Permalink
- Report Inappropriate Content
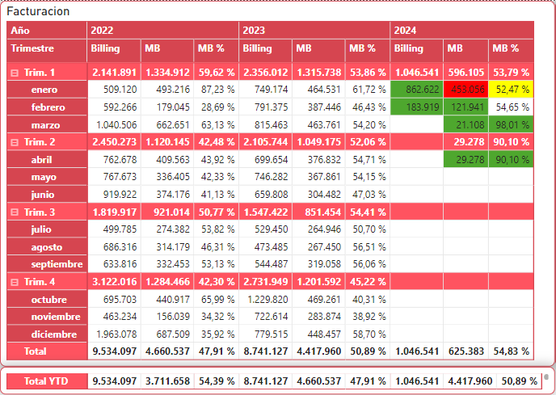
No entiendo, yo necesito 2 filas de total, uno para el total annual y otro para el total YTD y no consigo hacerlo en la misma tabla
Como puedo hacer para añadir el total de fila YTD que me falta?
Helpful resources

Microsoft Fabric Learn Together
Covering the world! 9:00-10:30 AM Sydney, 4:00-5:30 PM CET (Paris/Berlin), 7:00-8:30 PM Mexico City

Power BI Monthly Update - April 2024
Check out the April 2024 Power BI update to learn about new features.

| User | Count |
|---|---|
| 112 | |
| 100 | |
| 76 | |
| 64 | |
| 63 |
| User | Count |
|---|---|
| 142 | |
| 105 | |
| 102 | |
| 80 | |
| 67 |


