Jumpstart your career with the Fabric Career Hub
Find everything you need to get certified on Fabric—skills challenges, live sessions, exam prep, role guidance, and more.
Get started- Power BI forums
- Updates
- News & Announcements
- Get Help with Power BI
- Desktop
- Service
- Report Server
- Power Query
- Mobile Apps
- Developer
- DAX Commands and Tips
- Custom Visuals Development Discussion
- Health and Life Sciences
- Power BI Spanish forums
- Translated Spanish Desktop
- Training and Consulting
- Instructor Led Training
- Dashboard in a Day for Women, by Women
- Galleries
- Community Connections & How-To Videos
- COVID-19 Data Stories Gallery
- Themes Gallery
- Data Stories Gallery
- R Script Showcase
- Webinars and Video Gallery
- Quick Measures Gallery
- 2021 MSBizAppsSummit Gallery
- 2020 MSBizAppsSummit Gallery
- 2019 MSBizAppsSummit Gallery
- Events
- Ideas
- Custom Visuals Ideas
- Issues
- Issues
- Events
- Upcoming Events
- Community Blog
- Power BI Community Blog
- Custom Visuals Community Blog
- Community Support
- Community Accounts & Registration
- Using the Community
- Community Feedback
Grow your Fabric skills and prepare for the DP-600 certification exam by completing the latest Microsoft Fabric challenge.
- Power BI forums
- Forums
- Get Help with Power BI
- Desktop
- Re: How to sort the rolling 12 months and prior ro...
- Subscribe to RSS Feed
- Mark Topic as New
- Mark Topic as Read
- Float this Topic for Current User
- Bookmark
- Subscribe
- Printer Friendly Page
- Mark as New
- Bookmark
- Subscribe
- Mute
- Subscribe to RSS Feed
- Permalink
- Report Inappropriate Content
How to sort the rolling 12 months and prior rolling 12 months by month and year
Hello,
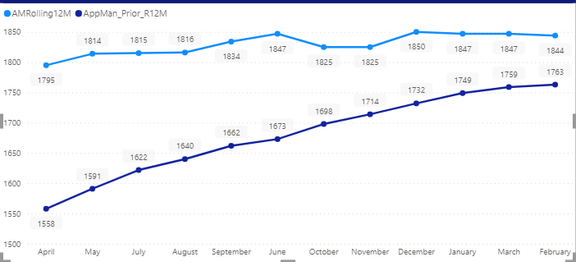
I have the following graph, that is showing the current rolling 12 months and prior rolling 12 months using variables (taking Greg's advice, since "Calculate" didn't work for me in this case and it is considered the quantum physics of Power BI), and the issue I have here is that I can't sort the x-axis by month and year (in this format: April 2022 etc., from April through December are months that belong to the year 2022, and January through March belong to the year 2023)
I've tried all other options with the date table, different DAX calculations, and x-axis formats but the only accurate output occurs when I filter by the [Expanded_Date]Month column.
Any help is much appreciated. Google Drive, Power BI file used
AMRolling12M =

VAR CurrentDate = MAX(AMD_Main[ExpandedDate])

VAR StartDate = DATE(YEAR(CurrentDate) - 1, MONTH(CurrentDate), DAY(CurrentDate))

VAR EndDate = CurrentDate

VAR AMRolling12M =

    CALCULATE(

        SUM(AMD_Main[NullFill]),

        DATESBETWEEN(

            AMD_Main[ExpandedDate],

            StartDate,

            EndDate

        )

    )

RETURN AMRolling12M
AppMan_Prior_R12M =

VAR CurrentDate = MAX(AMD_Main[ExpandedDate])

VAR PriorRolling12Months =

    SUMX(

        FILTER(

            AMD_Main,

            AMD_Main[ExpandedDate] >= DATE(YEAR(CurrentDate) - 2, MONTH(CurrentDate), DAY(CurrentDate)) &&

            AMD_Main[ExpandedDate] < DATE(YEAR(CurrentDate) - 1, MONTH(CurrentDate), DAY(CurrentDate))

        ),

        AMD_Main[NullFill]

    )

RETURN

    PriorRolling12Months
- Mark as New
- Bookmark
- Subscribe
- Mute
- Subscribe to RSS Feed
- Permalink
- Report Inappropriate Content
Hi @Jack_Reacher ,
The function DATESBETWEEN in the measure can't scan all the table which is affected by context. I modify the formula like this:
AMRolling12M =
VAR CurrentDate =
    MAX ( AMD_Main[ExpandedDate] )
VAR StartDate =
    DATE ( YEAR ( CurrentDate ) - 1, MONTH ( CurrentDate ), DAY ( CurrentDate ) )
VAR EndDate = CurrentDate
VAR AMRolling12M =
    CALCULATE (
        SUM ( AMD_Main[NullFill] ),
        FILTER (
            ALL ( 'AMD_Main' ),
            'AMD_Main'[ExpandedDate] >= StartDate
                && 'AMD_Main'[ExpandedDate] <= EndDate
        )
    )
RETURN
    AMRolling12M
AppMan_Prior_R12M =
VAR CurrentDate =
    MAX ( AMD_Main[ExpandedDate] )
VAR PriorRolling12Months =
    SUMX (
        FILTER (
            ALL ( AMD_Main ),
            AMD_Main[ExpandedDate]
                >= DATE ( YEAR ( CurrentDate ) - 2, MONTH ( CurrentDate ), DAY ( CurrentDate ) )
                && AMD_Main[ExpandedDate]
                    < DATE ( YEAR ( CurrentDate ) - 1, MONTH ( CurrentDate ), DAY ( CurrentDate ) )
        ),
        AMD_Main[NullFill]
    )
RETURN
    PriorRolling12Months
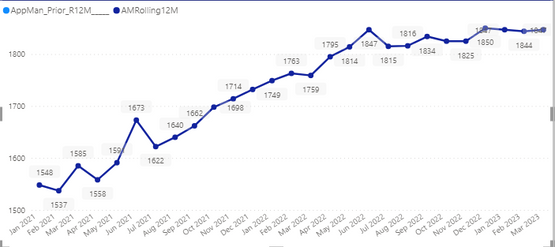
Get the correct result:
I attach the file below for your reference.
If this post helps, then please consider Accept it as the solution to help the other members find it more quickly.
Best regards,
Community Support Team_yanjiang
- Mark as New
- Bookmark
- Subscribe
- Mute
- Subscribe to RSS Feed
- Permalink
- Report Inappropriate Content
Hi @Jack_Reacher ,
I do not know if I undersrand right.
But why you dont do like this:
1-On X-Axis, Put the PeriodCal__ Column.
2-Create a CALCULATED COLUMN in AMD_Main Table:
PeriodCalIndex = RANKX(AMD_Main,CONVERT(FORMAT(AMD_Main[ExpandedDate],"YYYYMM"),INTEGER),,ASC,Dense)
3-Sort PeriodCal__ Column by PeriodCalIndex Calculated Column.
It helped?
Mark it as an accepted solution.
Regards,
Loran
- Mark as New
- Bookmark
- Subscribe
- Mute
- Subscribe to RSS Feed
- Permalink
- Report Inappropriate Content
@MohammadLoran25 , Hello Mohammad,
Thanks for your reply, unfortunately, it didn't give me the correct output.
Kindly check the file I have attached here Google Drive, Power BI file used
Helpful resources

Europe’s largest Microsoft Fabric Community Conference
Join the community in Stockholm for expert Microsoft Fabric learning including a very exciting keynote from Arun Ulag, Corporate Vice President, Azure Data.

Power BI Monthly Update - June 2024
Check out the June 2024 Power BI update to learn about new features.

| User | Count |
|---|---|
| 89 | |
| 86 | |
| 79 | |
| 69 | |
| 68 |
| User | Count |
|---|---|
| 226 | |
| 129 | |
| 119 | |
| 83 | |
| 77 |


