- Power BI forums
- Updates
- News & Announcements
- Get Help with Power BI
- Desktop
- Service
- Report Server
- Power Query
- Mobile Apps
- Developer
- DAX Commands and Tips
- Custom Visuals Development Discussion
- Health and Life Sciences
- Power BI Spanish forums
- Translated Spanish Desktop
- Power Platform Integration - Better Together!
- Power Platform Integrations (Read-only)
- Power Platform and Dynamics 365 Integrations (Read-only)
- Training and Consulting
- Instructor Led Training
- Dashboard in a Day for Women, by Women
- Galleries
- Community Connections & How-To Videos
- COVID-19 Data Stories Gallery
- Themes Gallery
- Data Stories Gallery
- R Script Showcase
- Webinars and Video Gallery
- Quick Measures Gallery
- 2021 MSBizAppsSummit Gallery
- 2020 MSBizAppsSummit Gallery
- 2019 MSBizAppsSummit Gallery
- Events
- Ideas
- Custom Visuals Ideas
- Issues
- Issues
- Events
- Upcoming Events
- Community Blog
- Power BI Community Blog
- Custom Visuals Community Blog
- Community Support
- Community Accounts & Registration
- Using the Community
- Community Feedback
Register now to learn Fabric in free live sessions led by the best Microsoft experts. From Apr 16 to May 9, in English and Spanish.
- Power BI forums
- Power BI Spanish forums
- Translated Spanish Desktop
- Organizar Productos por fecha de altas y bajas
- Subscribe to RSS Feed
- Mark Topic as New
- Mark Topic as Read
- Float this Topic for Current User
- Bookmark
- Subscribe
- Printer Friendly Page
- Mark as New
- Bookmark
- Subscribe
- Mute
- Subscribe to RSS Feed
- Permalink
- Report Inappropriate Content
Organizar Productos por fecha de altas y bajas
Hola!
Tengo un informe en el que se necesita realizar los siguientes cálculos por cada Producto:
- Fecha de alta producto (Con la fecha más reciente por Producto)
- Fecha de baja de producto (Fecha más reciente por Producto)
Con la siguiente estructura:
Y que al final pueda organizar por cada producto la FechaAlta, FechaBaja (si no hay fecha de baja de producto, estará en blanco) con la siguiente estructura:
Muchas gracias!
Solved! Go to Solution.
- Mark as New
- Bookmark
- Subscribe
- Mute
- Subscribe to RSS Feed
- Permalink
- Report Inappropriate Content
Estos son los pasos que puede seguir:
1. Crear columna calculada.
maxgroup_date =
var _max=MAXX(FILTER(ALL('Table'),
'Table'[Product]=EARLIER('Table'[Product])&&'Table'[TipoDeSolicitud]=EARLIER('Table'[TipoDeSolicitud])),[FechaSolicitud])
return
IF(
    'Table'[TipoDeSolicitud]="Alta",_max)
maxdate =
var _maxdate = MAXX(ALL('Table')
,[FechaSolicitud])
return
IF(
'Table'[TipoDeSolicitud]="Baja",_maxdate)2. Crear tabla calculada.
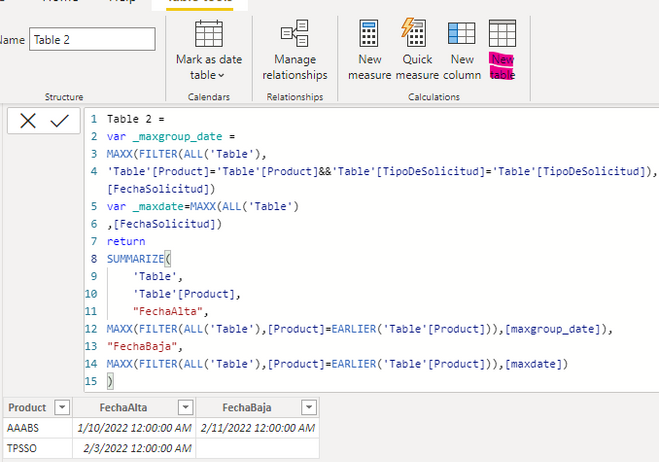
Table 2 =
SUMMARIZE(
    'Table',
    'Table'[Product],
    "FechaAlta",
MAXX(FILTER(ALL('Table'),[Product]=EARLIER('Table'[Product])),[maxgroup_date]),
"FechaBaja",
MAXX(FILTER(ALL('Table'),[Product]=EARLIER('Table'[Product])),[maxdate])
)
3. Resultado:
Saludos
Liu Yang
Si esta publicación ayuda, considere Aceptarla como la solución para ayudar a los otros miembros a encontrarla más rápidamente
Helpful resources

Microsoft Fabric Learn Together
Covering the world! 9:00-10:30 AM Sydney, 4:00-5:30 PM CET (Paris/Berlin), 7:00-8:30 PM Mexico City

Power BI Monthly Update - April 2024
Check out the April 2024 Power BI update to learn about new features.

| User | Count |
|---|---|
| 2 | |
| 2 | |
| 2 | |
| 2 | |
| 1 |


