- Power BI forums
- Updates
- News & Announcements
- Get Help with Power BI
- Desktop
- Service
- Report Server
- Power Query
- Mobile Apps
- Developer
- DAX Commands and Tips
- Custom Visuals Development Discussion
- Health and Life Sciences
- Power BI Spanish forums
- Translated Spanish Desktop
- Power Platform Integration - Better Together!
- Power Platform Integrations (Read-only)
- Power Platform and Dynamics 365 Integrations (Read-only)
- Training and Consulting
- Instructor Led Training
- Dashboard in a Day for Women, by Women
- Galleries
- Community Connections & How-To Videos
- COVID-19 Data Stories Gallery
- Themes Gallery
- Data Stories Gallery
- R Script Showcase
- Webinars and Video Gallery
- Quick Measures Gallery
- 2021 MSBizAppsSummit Gallery
- 2020 MSBizAppsSummit Gallery
- 2019 MSBizAppsSummit Gallery
- Events
- Ideas
- Custom Visuals Ideas
- Issues
- Issues
- Events
- Upcoming Events
- Community Blog
- Power BI Community Blog
- Custom Visuals Community Blog
- Community Support
- Community Accounts & Registration
- Using the Community
- Community Feedback
Register now to learn Fabric in free live sessions led by the best Microsoft experts. From Apr 16 to May 9, in English and Spanish.
- Power BI forums
- Forums
- Get Help with Power BI
- Service
- Re: last time refresh
- Subscribe to RSS Feed
- Mark Topic as New
- Mark Topic as Read
- Float this Topic for Current User
- Bookmark
- Subscribe
- Printer Friendly Page
- Mark as New
- Bookmark
- Subscribe
- Mute
- Subscribe to RSS Feed
- Permalink
- Report Inappropriate Content
last time refresh
Hi,
Is it possible to add to the report/dashboard the date and time of the last refresh?
Many thanks.
Nir
Solved! Go to Solution.
- Mark as New
- Bookmark
- Subscribe
- Mute
- Subscribe to RSS Feed
- Permalink
- Report Inappropriate Content
Hi,
Maybe this will solution will help,
http://www.powerpivotpro.com/2010/11/add-a-last-refreshed-date-readout/
I will try tommorow and update 🙂
- Mark as New
- Bookmark
- Subscribe
- Mute
- Subscribe to RSS Feed
- Permalink
- Report Inappropriate Content
Hi nir,
You can add a calculated column (Last Refresh Column) in the model with the formula =NOW()
And measure Last Refresh Date :=MAX(Table[Last Refresh Column])
Since calculated columns are calculated only on model refresh - it will make sure the calc is right
- Mark as New
- Bookmark
- Subscribe
- Mute
- Subscribe to RSS Feed
- Permalink
- Report Inappropriate Content
Ignore my message.
- Mark as New
- Bookmark
- Subscribe
- Mute
- Subscribe to RSS Feed
- Permalink
- Report Inappropriate Content
Hi ALL,
Add a column to your dataset with the below formula.
Last Refresh Date Time =DateTimeZone.LocalNow()
This will get refresh only,when you click the refresh button. It is working 100% correct. I'm using in my current project PBI Reports.
- Mark as New
- Bookmark
- Subscribe
- Mute
- Subscribe to RSS Feed
- Permalink
- Report Inappropriate Content
Hi All,
Add a column to your dataset with the below formula.
Last Refresh Date Time =DateTimeZone.LocalNow()
This will get refresh only,when you click the refresh button. It is working 100% correct. I'm using in my current project PBI Reports.
- Mark as New
- Bookmark
- Subscribe
- Mute
- Subscribe to RSS Feed
- Permalink
- Report Inappropriate Content
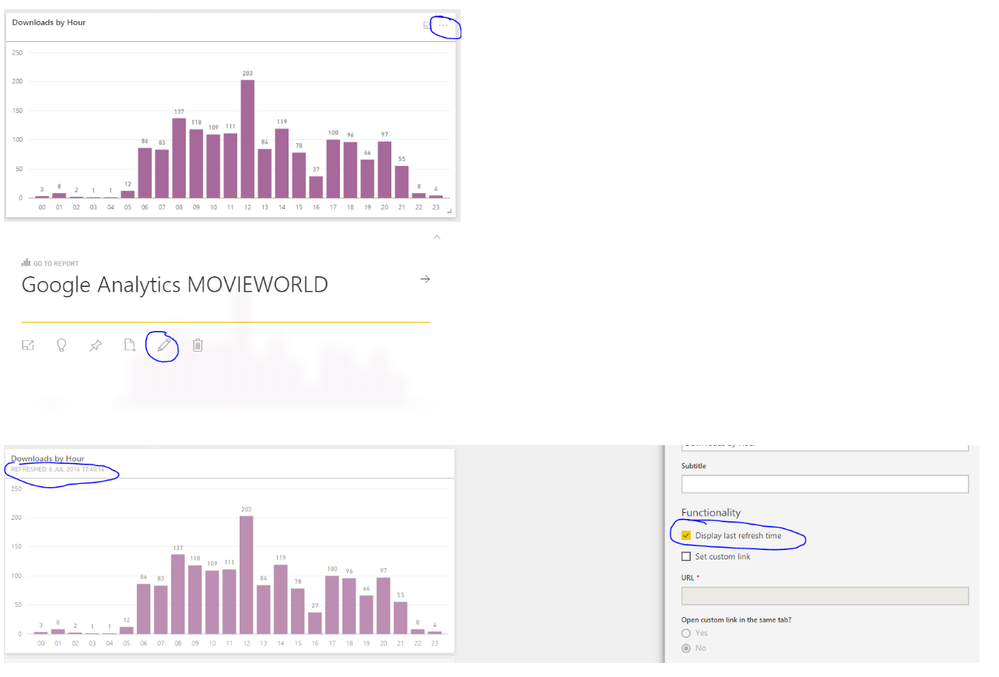
Not sure when this feature was added but I just spotted it today
Click on the ... in your dashboard, clcik on the pencil to edit, select display last refresh
- Mark as New
- Bookmark
- Subscribe
- Mute
- Subscribe to RSS Feed
- Permalink
- Report Inappropriate Content
I am seeing all these people saying to hover over the tile and click the elipse button... but I do not get the edit or pencil icon when clicking the elipse button when in the dashboard or report. Is there an IE/Edge configuration I need to uncheck in order to get the edit (pencil) button when clicking the elipse button?
Thanks.
- Mark as New
- Bookmark
- Subscribe
- Mute
- Subscribe to RSS Feed
- Permalink
- Report Inappropriate Content
Hi @vkdubw, I'm not aware of any issue. My dashboards are not affected by Chrome or Edge.
Are you able to post a screenshot?
I'm not sure if the source of the dashboard is an issue. Are you getitng your dashboard from a Content Pack or just creating it yourself?
- Mark as New
- Bookmark
- Subscribe
- Mute
- Subscribe to RSS Feed
- Permalink
- Report Inappropriate Content
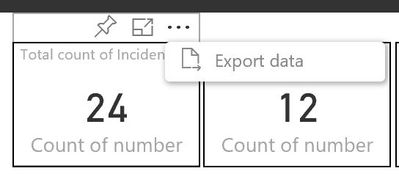
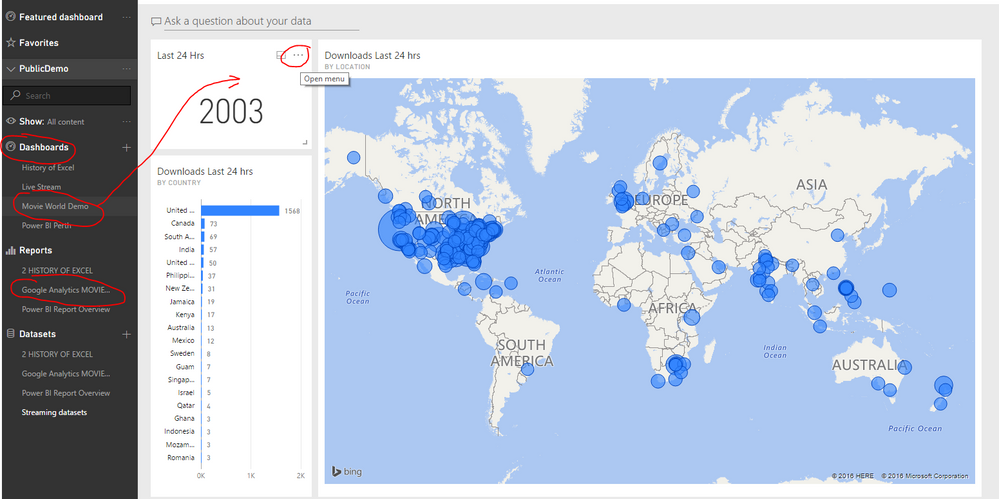
Thanks for the quick response. Hereare the screenshots from theDashboard (Lst 24 hours) and the Report (Export Only). I originally created the dashboard with PBI Desktop and published.
- Mark as New
- Bookmark
- Subscribe
- Mute
- Subscribe to RSS Feed
- Permalink
- Report Inappropriate Content
No problem @vkdubw, it looks like your screenshots are from the report view (I can siee the pin to dashboard icon)
The last time refreshed ellipse is only available in the Dashboard view. So if you use the pin icon to add the visual to a dashboard then you shold see a different set of options on the elipse when in Dashboard View
- Mark as New
- Bookmark
- Subscribe
- Mute
- Subscribe to RSS Feed
- Permalink
- Report Inappropriate Content
Yes, that's what I'm expecting in the Dashboard view, but there I see nothing. The screenshot from the "Last 24 hours" is the one from the Dashboard view. When clicking on the box in the Dashboard view, I see nothing, just the faint outline of the tile. I will say the Dashboard and the Report have two different names. I've seen in other areas there may be issues if things are named differently, could this be the case here though?
thanks.
- Mark as New
- Bookmark
- Subscribe
- Mute
- Subscribe to RSS Feed
- Permalink
- Report Inappropriate Content
- Mark as New
- Bookmark
- Subscribe
- Mute
- Subscribe to RSS Feed
- Permalink
- Report Inappropriate Content
Yep, that's exactly where I'm at. I'm going to give it a few days of rest then pick it up again. Thanks for the confirmation that I'm looking in the correct area.
- Mark as New
- Bookmark
- Subscribe
- Mute
- Subscribe to RSS Feed
- Permalink
- Report Inappropriate Content
@vkdubw what type of graphic is that "Last 24 hours" in the dashboard - is it a standard Card?
- Mark as New
- Bookmark
- Subscribe
- Mute
- Subscribe to RSS Feed
- Permalink
- Report Inappropriate Content
ya, that particular one is a text box but it's the same with all the tiles. Number, Filter, Bar Graph. the tiles just highlight, nothing shows up in the upper right of the tile. I was in a meeting and brought this up yesterday and was told this feature was disabled on PowerBI with the latest release. I haven't been able to find any note or paper mentioning that but am going to look for it today.
thanks again.
- Mark as New
- Bookmark
- Subscribe
- Mute
- Subscribe to RSS Feed
- Permalink
- Report Inappropriate Content
@vkdubw, feature still working for me (in Australia) - I just created a brand new dashboard on a "free" user licence in case it was a pro v free thing, but still works.
- Mark as New
- Bookmark
- Subscribe
- Mute
- Subscribe to RSS Feed
- Permalink
- Report Inappropriate Content
Coming to this topic late. But I should note that the time refresh it will say in the dashboard is not the time the data set was last refreshed, just the time the dashboard tile was refreshed which will mislead any user.
- Mark as New
- Bookmark
- Subscribe
- Mute
- Subscribe to RSS Feed
- Permalink
- Report Inappropriate Content
HI @Anonymous,
I just refreshed my data set and the dashboard date refreshed has updated as expected. So I don't seem to have an issue there.
How do you refresh just a dashboard tile?
Thanks
Wyn
- Mark as New
- Bookmark
- Subscribe
- Mute
- Subscribe to RSS Feed
- Permalink
- Report Inappropriate Content
Hi,
I was noticing that you can have the dashboard tiles displaying a recent refresh date even though the data set itself has not been refreshed, so I think it would mislead the user about the data.
You can click on the ... in the top left of your dashboard next to share, and there is an option to refresh the dashboard tiles as well.
- Mark as New
- Bookmark
- Subscribe
- Mute
- Subscribe to RSS Feed
- Permalink
- Report Inappropriate Content
Interesting point, never thought to refresh a dashboard tile independenlty of data refresh.
The whole Dashboard and Report refresh options seem misleading. Data Refresh should be all that's required IMHO
- Mark as New
- Bookmark
- Subscribe
- Mute
- Subscribe to RSS Feed
- Permalink
- Report Inappropriate Content
Wyn,
Nice - I'll second this one.
My experience is that end users only care if the data is current and actionable OR if it is potentially too stale to use. Whether a tile has refreshed or not has no meaningful implication to them - and it does create confustion.
To address this, would it be worth considering this change:
1) "Refresh" should mean "source data last refreshed time".
This data already exists in the admin control panel - so it would seem possible to make it an option to show this in the tile refresh pane. If this change could be implemented, it would lead to the second issue...
2) "Source data last refreshed time" should be in the time zone of the viewer or in hours since last source data refresh.
Right now, PowerBI has an issue of reference time - source data refresh can be "last refreshed at server time" or "last refreshed local PBIX time" - depending on how it is pubished. This leads to end user confusion. If end user local time to end user is not obtainable - "source data last refreshed" might be better as a clock of hours lapsed since last successful refresh.
Thoughts?
- Mark as New
- Bookmark
- Subscribe
- Mute
- Subscribe to RSS Feed
- Permalink
- Report Inappropriate Content
You can show this on a tile in a dashboard by clicking the ... on the top right hand corner of the tile, then click the edit pencil, then check the "Display last refresh time". The refresh time will now show at the top of the tile
Helpful resources

Microsoft Fabric Learn Together
Covering the world! 9:00-10:30 AM Sydney, 4:00-5:30 PM CET (Paris/Berlin), 7:00-8:30 PM Mexico City

Power BI Monthly Update - April 2024
Check out the April 2024 Power BI update to learn about new features.


