- Power BI forums
- Updates
- News & Announcements
- Get Help with Power BI
- Desktop
- Service
- Report Server
- Power Query
- Mobile Apps
- Developer
- DAX Commands and Tips
- Custom Visuals Development Discussion
- Health and Life Sciences
- Power BI Spanish forums
- Translated Spanish Desktop
- Power Platform Integration - Better Together!
- Power Platform Integrations (Read-only)
- Power Platform and Dynamics 365 Integrations (Read-only)
- Training and Consulting
- Instructor Led Training
- Dashboard in a Day for Women, by Women
- Galleries
- Community Connections & How-To Videos
- COVID-19 Data Stories Gallery
- Themes Gallery
- Data Stories Gallery
- R Script Showcase
- Webinars and Video Gallery
- Quick Measures Gallery
- 2021 MSBizAppsSummit Gallery
- 2020 MSBizAppsSummit Gallery
- 2019 MSBizAppsSummit Gallery
- Events
- Ideas
- Custom Visuals Ideas
- Issues
- Issues
- Events
- Upcoming Events
- Community Blog
- Power BI Community Blog
- Custom Visuals Community Blog
- Community Support
- Community Accounts & Registration
- Using the Community
- Community Feedback
Register now to learn Fabric in free live sessions led by the best Microsoft experts. From Apr 16 to May 9, in English and Spanish.
- Power BI forums
- Forums
- Get Help with Power BI
- Service
- Re: Struggling to get Visuals to Interact with Eac...
- Subscribe to RSS Feed
- Mark Topic as New
- Mark Topic as Read
- Float this Topic for Current User
- Bookmark
- Subscribe
- Printer Friendly Page
- Mark as New
- Bookmark
- Subscribe
- Mute
- Subscribe to RSS Feed
- Permalink
- Report Inappropriate Content
Struggling to get Visuals to Interact with Eachother
Hi All,
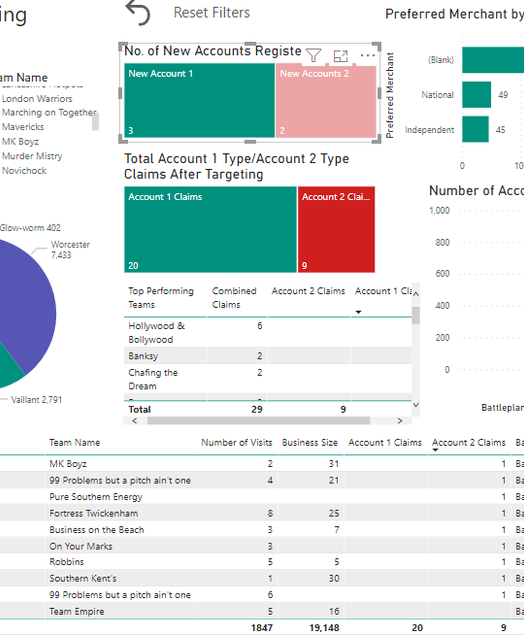
I've been struggling with this all day. Here is a screenshot of my dashboard and I can't get the Treemap to filter the table below. I've tried using measures, two way relationships etc. to no avail. You can see in the screenshot that I'm filtering on the number of new accounts but it doesn't affect the table at the bottom. Any ideas why that might be? Both tables are linking using account numbers so in theory it should filter through but doesn't.
The only thing I can think of is that the Values being compared in the Treemap are from two different tables but that's just a guess? If any more details are needed give me a shout.
Many thanks,
Rob
Solved! Go to Solution.
- Mark as New
- Bookmark
- Subscribe
- Mute
- Subscribe to RSS Feed
- Permalink
- Report Inappropriate Content
Hi @Amos1992 ,
There are mainly 2 factors due to which filtering might not be happening:
1. No relationship between fields of both visuals
2. Treemap to Table Filtering disabled from Edit Interactions
You will need to check the below in such scenario:
1. Relationship must exist between the fields/dataset used in treemap and fields/dataset used in table
2. Take a new table viz for verifying if relationship exists: Pull all the fields from treemap viz and table viz; Now apply visual level filter and check whether filtering is happening
If yes, then relationship exists;
Delete the sample table created in this step later.
3. Make sure the field in treemap's Group has relationship with at least 1 field used in table
4. Check the interaction from Format -> Edit Interaction and confirm if treemap is filtering table or not.
Give a thumbs up if this post helped you in any way and mark this post as solution if it solved your query !!!
- Mark as New
- Bookmark
- Subscribe
- Mute
- Subscribe to RSS Feed
- Permalink
- Report Inappropriate Content
In order for the visuals to interact there has to be a relationship between the tables if you want the visuals to interact.
Or the values from a single table would need to exist in both the treemap and table?
Helpful resources

Microsoft Fabric Learn Together
Covering the world! 9:00-10:30 AM Sydney, 4:00-5:30 PM CET (Paris/Berlin), 7:00-8:30 PM Mexico City

Power BI Monthly Update - April 2024
Check out the April 2024 Power BI update to learn about new features.


