- Power BI forums
- Updates
- News & Announcements
- Get Help with Power BI
- Desktop
- Service
- Report Server
- Power Query
- Mobile Apps
- Developer
- DAX Commands and Tips
- Custom Visuals Development Discussion
- Health and Life Sciences
- Power BI Spanish forums
- Translated Spanish Desktop
- Power Platform Integration - Better Together!
- Power Platform Integrations (Read-only)
- Power Platform and Dynamics 365 Integrations (Read-only)
- Training and Consulting
- Instructor Led Training
- Dashboard in a Day for Women, by Women
- Galleries
- Community Connections & How-To Videos
- COVID-19 Data Stories Gallery
- Themes Gallery
- Data Stories Gallery
- R Script Showcase
- Webinars and Video Gallery
- Quick Measures Gallery
- 2021 MSBizAppsSummit Gallery
- 2020 MSBizAppsSummit Gallery
- 2019 MSBizAppsSummit Gallery
- Events
- Ideas
- Custom Visuals Ideas
- Issues
- Issues
- Events
- Upcoming Events
- Community Blog
- Power BI Community Blog
- Custom Visuals Community Blog
- Community Support
- Community Accounts & Registration
- Using the Community
- Community Feedback
Register now to learn Fabric in free live sessions led by the best Microsoft experts. From Apr 16 to May 9, in English and Spanish.
- Power BI forums
- Forums
- Get Help with Power BI
- Service
- Re: Searching for parameters ... so painfully slow
- Subscribe to RSS Feed
- Mark Topic as New
- Mark Topic as Read
- Float this Topic for Current User
- Bookmark
- Subscribe
- Printer Friendly Page
- Mark as New
- Bookmark
- Subscribe
- Mute
- Subscribe to RSS Feed
- Permalink
- Report Inappropriate Content
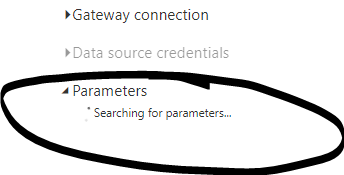
Searching for parameters ... so painfully slow
OK, I know that there is a bunch of back-end stuff that it is doing to recalculate gateways, data sources, and on and on.
But if I edit a normal, standard, boring parameter, I just want it to save my changes in a second. I don't want to sit there for 60 seconds while it shows me a spinning circle and says "Searching for parameters".
Who does the QA testing of this awful PBI portal? How can this behavior be acceptable? This seems like the most basic of U/I design flaws. It shouldn't be rocket science to figure out how to change a parameter, hit save, and not have to sit and wait for 60 seconds.
I blame the community for giving Microsoft a very low bar to pass, and allowing them shove really bad U/I design into their PBI portal. I know web-based U/I is generally pretty bad... however I have to believe you guys have encountered much better U/I on the Internet than this, right!?
Solved! Go to Solution.
- Mark as New
- Bookmark
- Subscribe
- Mute
- Subscribe to RSS Feed
- Permalink
- Report Inappropriate Content
I did some more investigation too. I think what is happening is that there is a handshake being done between the service and the on-prem datasource. I think this happens thru the on-prem-data-gateway (OPDG).
The U/I is, unfortunately, obfuscating the complex interactions that happen under the hood. It is likely that while the settings page says "searching for parameters", it is meanwhile waiting on round-trips to the OPDG, and possibly even to the underlying data source as well (built-in connectors, and/or custom connectors).
It would be really nice if customers of the PBI service could download an activity log with diagnostic information. There needs to be explain what we are waiting on for ~60 seconds. Most services have some basic level logging that is available for troubleshooting purposes, but I haven't found that in the Power BI service yet.
I intend to enable the extended logging capabilities of the OPDG and see if I can find anything on that side.
If the U/I was a tiny bit better, then the answer to these questions wouldn't be so mysterious. For example, U/I should say ... waiting on OPDG ... or something simple like that, and it would eliminate a great deal of confusion!
- Mark as New
- Bookmark
- Subscribe
- Mute
- Subscribe to RSS Feed
- Permalink
- Report Inappropriate Content
Hi @dbeavon3 ,
Best regards,
Community Support Team Selina zhu
If this post helps, then please consider Accept it as the solution to help the other members find it more quickly.
- Mark as New
- Bookmark
- Subscribe
- Mute
- Subscribe to RSS Feed
- Permalink
- Report Inappropriate Content
I did some more investigation too. I think what is happening is that there is a handshake being done between the service and the on-prem datasource. I think this happens thru the on-prem-data-gateway (OPDG).
The U/I is, unfortunately, obfuscating the complex interactions that happen under the hood. It is likely that while the settings page says "searching for parameters", it is meanwhile waiting on round-trips to the OPDG, and possibly even to the underlying data source as well (built-in connectors, and/or custom connectors).
It would be really nice if customers of the PBI service could download an activity log with diagnostic information. There needs to be explain what we are waiting on for ~60 seconds. Most services have some basic level logging that is available for troubleshooting purposes, but I haven't found that in the Power BI service yet.
I intend to enable the extended logging capabilities of the OPDG and see if I can find anything on that side.
If the U/I was a tiny bit better, then the answer to these questions wouldn't be so mysterious. For example, U/I should say ... waiting on OPDG ... or something simple like that, and it would eliminate a great deal of confusion!
Helpful resources

Microsoft Fabric Learn Together
Covering the world! 9:00-10:30 AM Sydney, 4:00-5:30 PM CET (Paris/Berlin), 7:00-8:30 PM Mexico City

Power BI Monthly Update - April 2024
Check out the April 2024 Power BI update to learn about new features.


