- Power BI forums
- Updates
- News & Announcements
- Get Help with Power BI
- Desktop
- Service
- Report Server
- Power Query
- Mobile Apps
- Developer
- DAX Commands and Tips
- Custom Visuals Development Discussion
- Health and Life Sciences
- Power BI Spanish forums
- Translated Spanish Desktop
- Power Platform Integration - Better Together!
- Power Platform Integrations (Read-only)
- Power Platform and Dynamics 365 Integrations (Read-only)
- Training and Consulting
- Instructor Led Training
- Dashboard in a Day for Women, by Women
- Galleries
- Community Connections & How-To Videos
- COVID-19 Data Stories Gallery
- Themes Gallery
- Data Stories Gallery
- R Script Showcase
- Webinars and Video Gallery
- Quick Measures Gallery
- 2021 MSBizAppsSummit Gallery
- 2020 MSBizAppsSummit Gallery
- 2019 MSBizAppsSummit Gallery
- Events
- Ideas
- Custom Visuals Ideas
- Issues
- Issues
- Events
- Upcoming Events
- Community Blog
- Power BI Community Blog
- Custom Visuals Community Blog
- Community Support
- Community Accounts & Registration
- Using the Community
- Community Feedback
Register now to learn Fabric in free live sessions led by the best Microsoft experts. From Apr 16 to May 9, in English and Spanish.
- Power BI forums
- Forums
- Get Help with Power BI
- Service
- Re: Published Report Filters Differently than PBI ...
- Subscribe to RSS Feed
- Mark Topic as New
- Mark Topic as Read
- Float this Topic for Current User
- Bookmark
- Subscribe
- Printer Friendly Page
- Mark as New
- Bookmark
- Subscribe
- Mute
- Subscribe to RSS Feed
- Permalink
- Report Inappropriate Content
Published Report Filters Differently than PBI Desktop
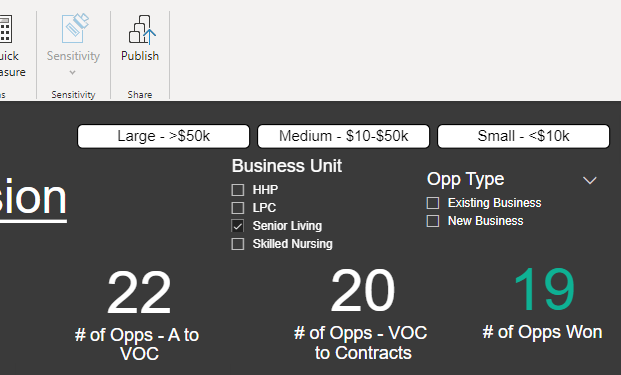
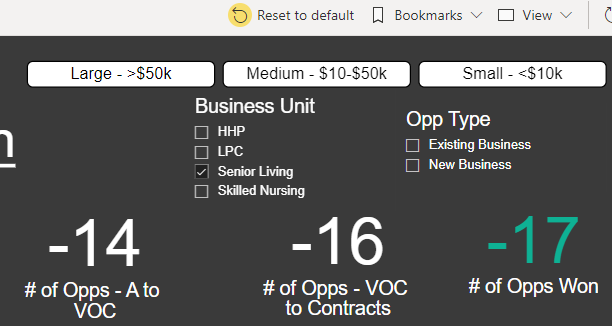
Ever since the November 2021 release I am having issues when filtering a particular published report which gives different (incorrect) results versus the same report and filters in PBI Desktop. I exported the details from the published report and it correctly shows 19 like the Desktop version shows, but the visual shows -17 (# of Closed Won). I have tested many things such as created new measures, duplicating the page, etc etc but having the same results. Note these are all measures I created that count/sum opportunity data from Salesforce, it all worked fine until the new release.
It only happens when filtering anything on the page; in this example I filtered the business unit and notice how the visuals are all incorrect and don't match:
Correct - PBI Desktop
Incorrect - PBI Published Service:
Solved! Go to Solution.
- Mark as New
- Bookmark
- Subscribe
- Mute
- Subscribe to RSS Feed
- Permalink
- Report Inappropriate Content
I logged in and checked my reports again and this is working correctly now on the services so something must have changed back. I just opened the same report that was incorrect before and it is correct now today.
- Mark as New
- Bookmark
- Subscribe
- Mute
- Subscribe to RSS Feed
- Permalink
- Report Inappropriate Content
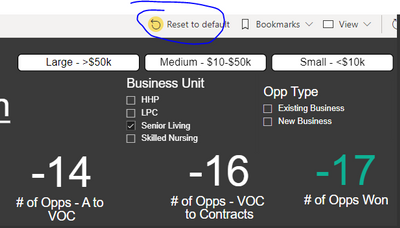
I definitely hit the reset to default button, I kept that on there to highlight that I added a filter which is what caused the data to not match up; it's all correct before I add the filter.
I attempted to do a save as on the PBI report and upload a completely new report and it still had this issue. I even uploaded it from a different computer on an older version of PBI.
Each card visual is referencing multiple other measures I built (all just simple counts and sums)
Only after the last update in November is this not working anymore, I simply just went onto the services; without uploading a new version or anything; and it was showing incorrectly like this.
- Mark as New
- Bookmark
- Subscribe
- Mute
- Subscribe to RSS Feed
- Permalink
- Report Inappropriate Content
Hello @RocketmanJP
I have tested the slicer on the service and it won't affect the result of the card. So the version issue you mentioned should not be.
What you said is a bit messy... So I want to ask
Did you add a filter in desktop or service?
The result doesn't match, so where(desktop or service) the data is correct?
If you update the desktop version but don't republish to the service, it won't affect the existing report in the service.
So what is the scene where the problem occurred, can you rephrase it?
Best Regards,
Community Support Team _ Janey
- Mark as New
- Bookmark
- Subscribe
- Mute
- Subscribe to RSS Feed
- Permalink
- Report Inappropriate Content
I will try to rephrase it;
Since the November 2021 update I am running into a bug where if you try to add any filter to a report that is published to the service it calculates everything incorrectly. Even if I upload the report with a filter already checked, it will come up showing incorrectly. On the same report in Desktop everything works correctly.
If you look back to my past posts you can see the screenshots I posted that show how the data looks different from PBI desktop vs PBI service (I did a save as, published the report to the service, and took the screenshots side by side to illustrate the bug).
Service: Desktop (correct) :
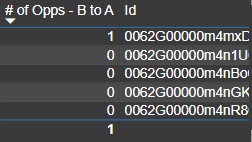
As you can see, same opp ID's being referenced, same filter. Only difference is that Service is calculating contexting incorrect since the update.
- Mark as New
- Bookmark
- Subscribe
- Mute
- Subscribe to RSS Feed
- Permalink
- Report Inappropriate Content
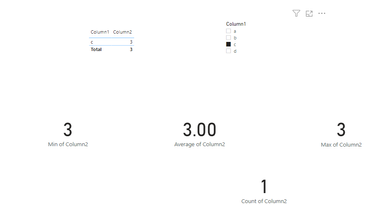
Simple test can't find the problem like yours:
What is the data source of the report that has the problem? Are you connected to the gateway in the service, can it be refreshed normally?
Do you mean that any newly created report will have this problem?
If yes, Can you provide your current desktop version and service version?
If possible, please provide a sample file with the problem (without privacy).
Best Regards,
Community Support Team _ Janey
- Mark as New
- Bookmark
- Subscribe
- Mute
- Subscribe to RSS Feed
- Permalink
- Report Inappropriate Content
- Mark as New
- Bookmark
- Subscribe
- Mute
- Subscribe to RSS Feed
- Permalink
- Report Inappropriate Content
I logged in and checked my reports again and this is working correctly now on the services so something must have changed back. I just opened the same report that was incorrect before and it is correct now today.
- Mark as New
- Bookmark
- Subscribe
- Mute
- Subscribe to RSS Feed
- Permalink
- Report Inappropriate Content
Hi, @RocketmanJP
Okay, If your problem has been solved, you can mark your answer as solution to close the thread. If my post helps, please consider Accept it as the solution to help the other members find it more quickly. If not, please feel free to ask me.
Best Regards,
Community Support Team _ Janey
- Mark as New
- Bookmark
- Subscribe
- Mute
- Subscribe to RSS Feed
- Permalink
- Report Inappropriate Content
Hi, @RocketmanJP
I do a simple test and don't find this problem. Do you have any information to add?
You need to confirm whether the context (filter slicer interaction) and data of the card visuals in the service and the desktop is consistent.
Some attempts:
1.You can reset to dafault in service.
2. You can re-publish the report to service.
3.Check if any data source is not connected, refresh the data.
If you still have problems, please share the code in the card visual.
Did I answer your question ? Please mark my reply as solution. Thank you very much.
If not, please feel free to ask me.
Best Regards,
Community Support Team _ Janey
Helpful resources

Microsoft Fabric Learn Together
Covering the world! 9:00-10:30 AM Sydney, 4:00-5:30 PM CET (Paris/Berlin), 7:00-8:30 PM Mexico City

Power BI Monthly Update - April 2024
Check out the April 2024 Power BI update to learn about new features.

