- Power BI forums
- Updates
- News & Announcements
- Get Help with Power BI
- Desktop
- Service
- Report Server
- Power Query
- Mobile Apps
- Developer
- DAX Commands and Tips
- Custom Visuals Development Discussion
- Health and Life Sciences
- Power BI Spanish forums
- Translated Spanish Desktop
- Power Platform Integration - Better Together!
- Power Platform Integrations (Read-only)
- Power Platform and Dynamics 365 Integrations (Read-only)
- Training and Consulting
- Instructor Led Training
- Dashboard in a Day for Women, by Women
- Galleries
- Community Connections & How-To Videos
- COVID-19 Data Stories Gallery
- Themes Gallery
- Data Stories Gallery
- R Script Showcase
- Webinars and Video Gallery
- Quick Measures Gallery
- 2021 MSBizAppsSummit Gallery
- 2020 MSBizAppsSummit Gallery
- 2019 MSBizAppsSummit Gallery
- Events
- Ideas
- Custom Visuals Ideas
- Issues
- Issues
- Events
- Upcoming Events
- Community Blog
- Power BI Community Blog
- Custom Visuals Community Blog
- Community Support
- Community Accounts & Registration
- Using the Community
- Community Feedback
Register now to learn Fabric in free live sessions led by the best Microsoft experts. From Apr 16 to May 9, in English and Spanish.
- Power BI forums
- Forums
- Get Help with Power BI
- Service
- How to run queries on each SSAS DBs
- Subscribe to RSS Feed
- Mark Topic as New
- Mark Topic as Read
- Float this Topic for Current User
- Bookmark
- Subscribe
- Printer Friendly Page
- Mark as New
- Bookmark
- Subscribe
- Mute
- Subscribe to RSS Feed
- Permalink
- Report Inappropriate Content
How to run queries on each SSAS DBs
To better describe my issue, I am trying to do a mimimum reproducible example in very few words so that someone willing to resolve this can take the MRE and try this out.
Let's suppose I have two SSAS DBs, e.g. sales1 and sales2 which I have published in my workspace.
SSAS model called sales1
| Calendar 	Table 	|

| Year 	|
| 2018 	|
| 2019 	|

| Fact 	Table  	|

| Year 	| Val 	|
| 2018 	| 1000 	|
| 2018 	| 2000 	|
| 2019 	| 3000 	|
| 2019 	| 4000 	|

| Measure 	Table 	|
Sales = SUMX('_sales1','_sales1'[Val])
------------------------

SSAS model called sales2
| Calendar 	Table 	|

| Year 	|
| 2020 	|
| 2021 	|

| Fact 	Table  	|

| Year 	| Val 	|
| 2020 	| 5000 	|
| 2020 	| 6000 	|
| 2021 	| 7000 	|
| 2021 	| 8000 	|

| Measure 	Table 	|
Sales = SUMX('_sales2','_sales2'[Val])
I want to create a seperate dataset by running a SSAS query dynamically on each sales DB, e.g. which takes the SSAS DB name as parameter and returns the result against each DB.
SUMMARIZECOLUMNS('Calendar'[Year],"sales",[Sales])
let
    Source = AnalysisServices.Databases("powerbi://api.powerbi.com/v1.0/myorg/PBI Workspace", [Implementation="2.0"])[Name],
    #"Converted to Table" = Table.FromList(Source, null,{"Name"}),
    #"Filtered Rows" = Table.SelectRows(#"Converted to Table", each Text.StartsWith([Name], "sales")),
/*pass on DB name as parameter to SSAS*/
	#"Added Custom" = Table.AddColumn(#"Filtered Rows", "Custom", each AnalysisServices.Database("powerbi://api.powerbi.com/v1.0/myorg/PBI Workspace", ""&[Name]&"",[Query="EVALUATE SUMMARIZECOLUMNS('Calendar'[Year],""sales"",[Sales])", Implementation="2.0"])),
#"Removed Other Columns" = Table.SelectColumns(#"Added Custom",{"Custom"}),
    #"Expanded Custom" = Table.ExpandTableColumn(#"Removed Other Columns", "Custom", {"Year", "sales"}, {"Year", "sales"})
in
    #"Expanded Custom"
The query runs fine but when I publish this dataset back to workspace I get the following error.
@ lbendlin previously looked into it and suggested that it might be a live connection and data would always be live. But I have verified that and can confirm that the data is not live at all and since the schedule can't be refresehed, it contains stale data.
I have also tried to convert this into a dataflow and it does not work either. Is there any workaround to this? I am trying to avoid the situtation where I have to manually select each SSAS DBs and run the query manually on each of them.
Thank you in advance and sorry for the long post.
- Mark as New
- Bookmark
- Subscribe
- Mute
- Subscribe to RSS Feed
- Permalink
- Report Inappropriate Content
Hi @smpa01,
Please refer to the following post about the same error message and follow the steps it mentions to check.
https://community.powerbi.com/t5/Desktop/Data-sources-don-t-support-refresh/td-p/267155
If you still have some question, please don't hesitate to let me known.
Best Regards,
Link
Is that the answer you're looking for? If this post helps, then please consider Accept it as the solution. Really appreciate!
- Mark as New
- Bookmark
- Subscribe
- Mute
- Subscribe to RSS Feed
- Permalink
- Report Inappropriate Content
@v-xulin-mstf thanks for looking into it and what I have gathered from the post that either Enabling "Include in report refresh" or Disabling "Include in report refresh" might fix the problem. I tried both, yet I see the following in each instances
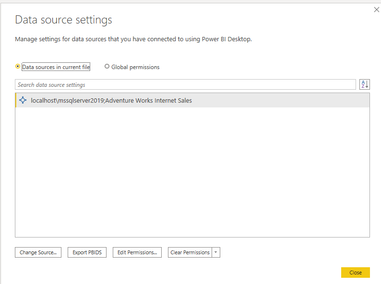
Additionally I see the following in my Data Source Settings.
Recap:- I am trying to run a SSAS qury on each of my SSAS DBs(DB name starts with sales) and pass on the name of the DB as query parameter on each SSAS query.
- Mark as New
- Bookmark
- Subscribe
- Mute
- Subscribe to RSS Feed
- Permalink
- Report Inappropriate Content
Hi @smpa01,
Is your issue solved? If the issue has been solved, please adopt the solution to help others.
If you still have some question, please don't hesitate to let me known.
Best Regards,
Link
Is that the answer you're looking for? If this post helps, then please consider Accept it as the solution. Really appreciate!
- Mark as New
- Bookmark
- Subscribe
- Mute
- Subscribe to RSS Feed
- Permalink
- Report Inappropriate Content
@v-xulin-mstf please hold on, it has not resolved my issue. I am going to discuss this in a call with MS.
- Mark as New
- Bookmark
- Subscribe
- Mute
- Subscribe to RSS Feed
- Permalink
- Report Inappropriate Content
Hi @smpa01,
How did you get the datasource?
From your screenshot, we know that you called an API interface, please check if this API interface successfully accesses the data source.
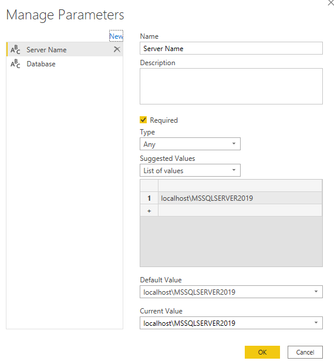
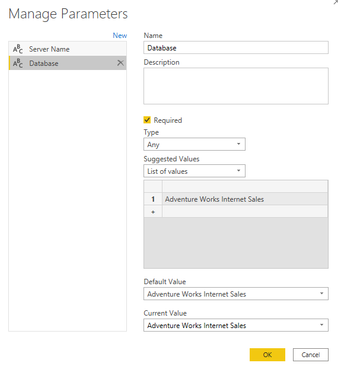
Based on my test, you can manage parameters in power query to meet your need.
In addition, please refer this troubleshooting to compare your datasource with the list of supported data sources found in Power BI data sources.
If you still have some question, please don't hesitate to let me known.
Best Regards,
Link
Is that the answer you're looking for? If this post helps, then please consider Accept it as the solution. Really appreciate!
- Mark as New
- Bookmark
- Subscribe
- Mute
- Subscribe to RSS Feed
- Permalink
- Report Inappropriate Content
- Mark as New
- Bookmark
- Subscribe
- Mute
- Subscribe to RSS Feed
- Permalink
- Report Inappropriate Content
@GilbertQ thanks for looking into it. The suggestion of bringing theses sales DBs as composite models does not solve my purpose. In reality there are nth number of sales DBs (sales1, sales2, ...sales35,salesn) which keeps on compounding. If I rely on bringing them as composite model, I need to keep on manually adding each DB in the composite model for each nth SSAS sales DB gets added in the workspace. I want to avoid that. I can utilize power query to my rescue for this which works beautifully but does not refresh on the workspace that defeats the purpose.
- Mark as New
- Bookmark
- Subscribe
- Mute
- Subscribe to RSS Feed
- Permalink
- Report Inappropriate Content
Hi @smpa01
What happens if you had to try and just connect via Analysis Services and put in the Query at the start. Then merge / append the tables later in PQ?
Helpful resources

Microsoft Fabric Learn Together
Covering the world! 9:00-10:30 AM Sydney, 4:00-5:30 PM CET (Paris/Berlin), 7:00-8:30 PM Mexico City

Power BI Monthly Update - April 2024
Check out the April 2024 Power BI update to learn about new features.


