- Power BI forums
- Updates
- News & Announcements
- Get Help with Power BI
- Desktop
- Service
- Report Server
- Power Query
- Mobile Apps
- Developer
- DAX Commands and Tips
- Custom Visuals Development Discussion
- Health and Life Sciences
- Power BI Spanish forums
- Translated Spanish Desktop
- Power Platform Integration - Better Together!
- Power Platform Integrations (Read-only)
- Power Platform and Dynamics 365 Integrations (Read-only)
- Training and Consulting
- Instructor Led Training
- Dashboard in a Day for Women, by Women
- Galleries
- Community Connections & How-To Videos
- COVID-19 Data Stories Gallery
- Themes Gallery
- Data Stories Gallery
- R Script Showcase
- Webinars and Video Gallery
- Quick Measures Gallery
- 2021 MSBizAppsSummit Gallery
- 2020 MSBizAppsSummit Gallery
- 2019 MSBizAppsSummit Gallery
- Events
- Ideas
- Custom Visuals Ideas
- Issues
- Issues
- Events
- Upcoming Events
- Community Blog
- Power BI Community Blog
- Custom Visuals Community Blog
- Community Support
- Community Accounts & Registration
- Using the Community
- Community Feedback
Register now to learn Fabric in free live sessions led by the best Microsoft experts. From Apr 16 to May 9, in English and Spanish.
- Power BI forums
- Forums
- Get Help with Power BI
- Service
- Re: Get List of Users accessing Reports in Power B...
- Subscribe to RSS Feed
- Mark Topic as New
- Mark Topic as Read
- Float this Topic for Current User
- Bookmark
- Subscribe
- Printer Friendly Page
- Mark as New
- Bookmark
- Subscribe
- Mute
- Subscribe to RSS Feed
- Permalink
- Report Inappropriate Content
Get List of Users accessing Reports in Power BI Service
Hi All,
I have a workspace with 3 Power BI Reports. I have given access individually to users for all 3 reports in Power BI Service.
For example, User A is given access to Report 1 and 2 and User B is given access to Report 2 and 3.
For Auditing purpose, may I know if it is possible to get the list of users having access to reports in a table format or a report format in Power BI Service, like the below screenshot:
| Users | Report |
| User A | Report 1 |
| User A | Report 2 |
| User B | Report 2 |
| User B | Report 3 |
Thank you.
Solved! Go to Solution.
- Mark as New
- Bookmark
- Subscribe
- Mute
- Subscribe to RSS Feed
- Permalink
- Report Inappropriate Content
The simplest solution is to use the metrics report. It gives you lots of insight of the usage of you reports and you don't have to build anything. Make sure to use the toggle the "New usage report" to "on". If you then want to combine multiple usage reports of all your reports I suggest to select "Safe a copy" of each metrics report and simply combine all visuals of intrest into a new dashboard. A dashboard uses visuals or the whole page of existing reports to condense the best infomation like usage metrics reports in your case.
1. Load the usage metrics report
2. Toggle "New usage report" in the upper right corner after the metrics report is loaded
3. Safe a copy of your report. Upper left corner above the metrics report.
- I advise you to create a new workspace just for the metrics report so that you can manage the access and permission rights better. This needs to be done before you hit "Save a copy" so that you will be able to select the new workspace as the destination for the copy.
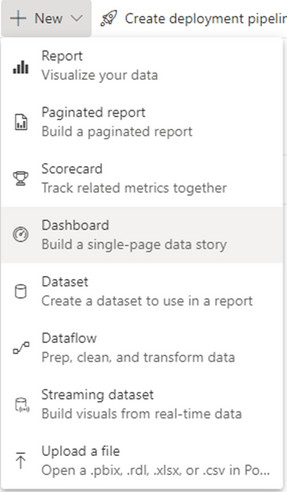
4. Create a dashboard
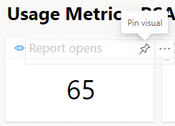
5. Pin visuals or the whole report page to your dashboard.
- For a single visual click "Edit" after you opened the metrics report. Then pin the visual to you dashboard. Repeat this for all the visuals you want to see in your dashboard.
- For a whole report page click the three dots above the metrics report and click "Pin to a dashboard". This is the easiest option I would say. This way your have all infos in one single dashboard for an overview.
Repeat all seps besides step 4 for all your reports 😁
I hope this helps and makes the auditing process much easier ✌️
If you find this helpful please give it a thumbs up and mark it as your solution 👍✅
Helpful resources

Microsoft Fabric Learn Together
Covering the world! 9:00-10:30 AM Sydney, 4:00-5:30 PM CET (Paris/Berlin), 7:00-8:30 PM Mexico City

Power BI Monthly Update - April 2024
Check out the April 2024 Power BI update to learn about new features.


