- Power BI forums
- Updates
- News & Announcements
- Get Help with Power BI
- Desktop
- Service
- Report Server
- Power Query
- Mobile Apps
- Developer
- DAX Commands and Tips
- Custom Visuals Development Discussion
- Health and Life Sciences
- Power BI Spanish forums
- Translated Spanish Desktop
- Power Platform Integration - Better Together!
- Power Platform Integrations (Read-only)
- Power Platform and Dynamics 365 Integrations (Read-only)
- Training and Consulting
- Instructor Led Training
- Dashboard in a Day for Women, by Women
- Galleries
- Community Connections & How-To Videos
- COVID-19 Data Stories Gallery
- Themes Gallery
- Data Stories Gallery
- R Script Showcase
- Webinars and Video Gallery
- Quick Measures Gallery
- 2021 MSBizAppsSummit Gallery
- 2020 MSBizAppsSummit Gallery
- 2019 MSBizAppsSummit Gallery
- Events
- Ideas
- Custom Visuals Ideas
- Issues
- Issues
- Events
- Upcoming Events
- Community Blog
- Power BI Community Blog
- Custom Visuals Community Blog
- Community Support
- Community Accounts & Registration
- Using the Community
- Community Feedback
Register now to learn Fabric in free live sessions led by the best Microsoft experts. From Apr 16 to May 9, in English and Spanish.
- Power BI forums
- Forums
- Get Help with Power BI
- Service
- Re: Gauge visual shows different number of decimal...
- Subscribe to RSS Feed
- Mark Topic as New
- Mark Topic as Read
- Float this Topic for Current User
- Bookmark
- Subscribe
- Printer Friendly Page
- Mark as New
- Bookmark
- Subscribe
- Mute
- Subscribe to RSS Feed
- Permalink
- Report Inappropriate Content
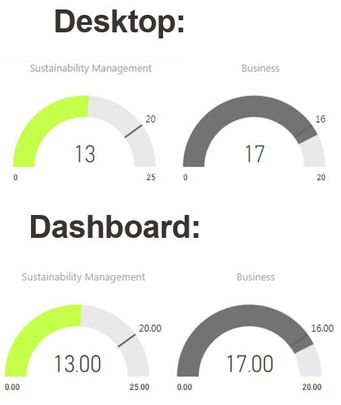
Gauge visual shows different number of decimals in dashboard than in Desktop
I have used the Gauge visual in showing some results in Power BI. Up until recently, it has worked well. One ogf the report users just notified that the Gauge shows currently two decimals for all values although in Desktop there are no decimals and I have also made sure that the Format is set to 0 decimals and even the format is "Whole number".
Has anyone else noticed the same and is this a bug, or something I can do to fix it? The report now looks very stupid.
Solved! Go to Solution.
- Mark as New
- Bookmark
- Subscribe
- Mute
- Subscribe to RSS Feed
- Permalink
- Report Inappropriate Content
Hi @helenah,
He issue is caused by average function. Based on my tested, the Average function in Value will keep two decimals in Power BI services. In order to avoid this issue, you can create measure like
AverageScore = AVERAGE(Table1[Score])
AverageMin = AVERAGE(Table1[Min])
Averagemax = AVERAGE(Table1[Max])
Besides, I will report this issue and hope this will be resolved in next release.
Regards,
Charlie Liao
- Mark as New
- Bookmark
- Subscribe
- Mute
- Subscribe to RSS Feed
- Permalink
- Report Inappropriate Content
Hi@helenah,
Which data type are you using? Could you please provide us a screenshoot of you source table? I have tested it on my local environment, we cannot reproduce this issue.
Regards,
Charlie Liao
- Mark as New
- Bookmark
- Subscribe
- Mute
- Subscribe to RSS Feed
- Permalink
- Report Inappropriate Content
Hi @v-caliao-msft,
Data type is whole number. I forgot to mention, that I have the average of that field in the gauge. I made a simple example power bi file which I could share with you by email.
Meanwhile, snapshots of my data and report below.


- Mark as New
- Bookmark
- Subscribe
- Mute
- Subscribe to RSS Feed
- Permalink
- Report Inappropriate Content
Hi,
This is a link to an example Power BI file I created to show this problem:
https://drive.google.com/open?id=0B47qZ88gRy8EcjIwZl9GTkN1YkE
Are you able to reproduce this issue? Is it a bug or can I fix ift somehow?
- Mark as New
- Bookmark
- Subscribe
- Mute
- Subscribe to RSS Feed
- Permalink
- Report Inappropriate Content
Hi @helenah,
He issue is caused by average function. Based on my tested, the Average function in Value will keep two decimals in Power BI services. In order to avoid this issue, you can create measure like
AverageScore = AVERAGE(Table1[Score])
AverageMin = AVERAGE(Table1[Min])
Averagemax = AVERAGE(Table1[Max])
Besides, I will report this issue and hope this will be resolved in next release.
Regards,
Charlie Liao
- Mark as New
- Bookmark
- Subscribe
- Mute
- Subscribe to RSS Feed
- Permalink
- Report Inappropriate Content
Thank you @v-caliao-msft for replying. The average used to work OK in the previous PowerBI Desktop version, it is only the recent one that shows the decimals with averages in Gauge. I have had the same report running for months and only now it does not work as expected. Really hoping it will be fixed soonest. Your solution is an OK workaround, but with the number of Gauges I have on my report, it is just too much work.
br,
Helena
Helpful resources

Microsoft Fabric Learn Together
Covering the world! 9:00-10:30 AM Sydney, 4:00-5:30 PM CET (Paris/Berlin), 7:00-8:30 PM Mexico City

Power BI Monthly Update - April 2024
Check out the April 2024 Power BI update to learn about new features.


