Register now to learn Fabric in free live sessions led by the best Microsoft experts. From Apr 16 to May 9, in English and Spanish.
Hi
I am getting this error message , please advise,
I have tried breaking down the problem and rebuilding a step that had a combine issue, yet still after that still getting this error
please advise what this means
Thanks
Alexander
Last refresh failed: Thu Jun 14 2018 17:30:17 GMT+0100 (GMT Daylight Time) Cancellation occurred when sending or receiving a request.Hide details Cluster URI: WABI-NORTH-EUROPE-redirect.analysis.windows.net Activity ID: afe82413-2848-4055-b9a6-ab8b86bd5663 Request ID: 694d46f6-95b7-abe7-eca0-863f40b0c3ed Time: 2018-06-14 16:30:17Z
HI @Alexander24,
You only share a general error message, it is hard to clarify your scenario without any detail information.
Please refer to below link to share more detailed contents:
Troubleshooting the On-premises data gateway
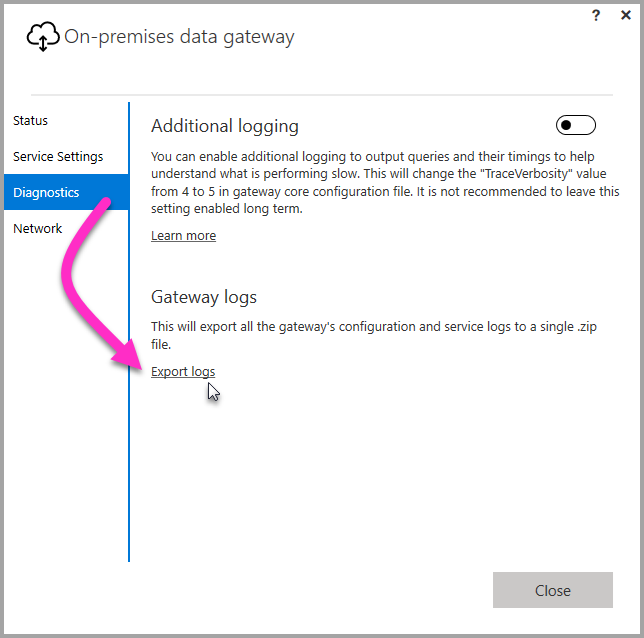
There are several logs you can collect for the gateway, and you should always start with the logs. The simplest way to collect logs after installing the gateway is through the user interface. In the On-premises data gateway user interface, select Diagnostics and then select the Export logs link near the bottom of the page, as shown in the following image.
Installer logs
%localappdata%\Temp\On-premises_data_gateway_*.log
Configuration logs
%localappdata%\Microsoft\On-premises Data Gateway\GatewayConfigurator*.log
On-premises data gateway service logs
C:\Users\PBIEgwService\AppData\Local\Microsoft\On-premises Data Gateway\Gateway*.log
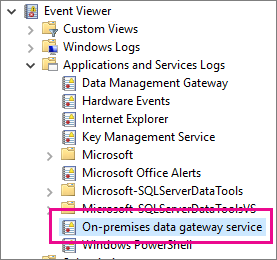
The On-premises data gateway service event logs are present under Application and Services Logs.
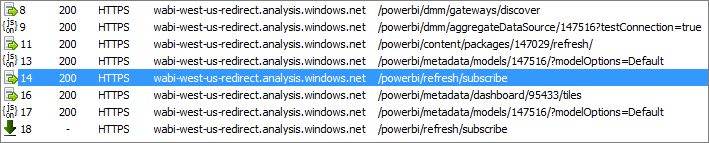
Fiddler is a free tool from Telerik that monitors HTTP traffic. You can see the back and forth with the Power BI service from the client machine. This may show errors and other related information.
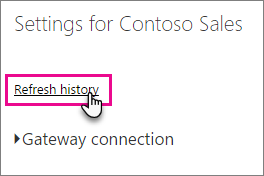
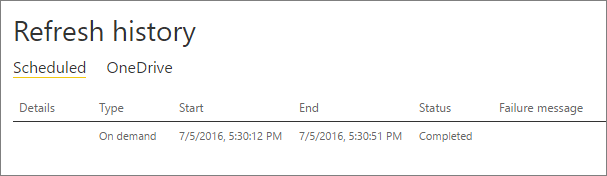
When using the gateway for scheduled refresh, Refresh History can help you see what errors have occurred, as well as provide useful data if you should need to create a support request. You can view both scheduled, as well as on demand, refreshes. Here is how you can get to the Refresh History.
In the Power BI navigation pane, in Datasets, select a dataset > Open Menu > Schedule Refresh.
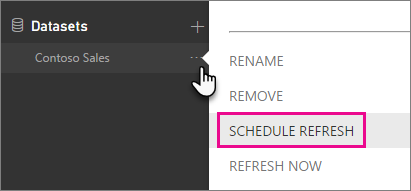
In Settings for... > Schedule Refresh, select Refresh History.
Regards,
Xiaoxin Sheng
Hi
I tried to narrow down to the errors in the dataset, hopefully this helps
Thanks
Alexander
Column6 12E2BD83 [DM.Pipeline.Common.TracingTelemetryService] Event: FireActivityCompletedWithFailureEvent (duration=3, err=UnknownSpooledOperationIdException, rootcauseErrorEventId=0) 25CB139C [DM.Pipeline.Common.TracingTelemetryService] Event: FireActivityCompletedWithFailureEvent (duration=4, err=UnknownSpooledOperationIdException, rootcauseErrorEventId=0) 287844E2 [DM.Pipeline.Common.TracingTelemetryService] Event: FireActivityCompletedWithFailureEvent (duration=2, err=UnknownSpooledOperationIdException, rootcauseErrorEventId=0) 302F8AC1 [DM.Pipeline.Common.TracingTelemetryService] Event: FireActivityCompletedWithFailureEvent (duration=1, err=UnknownSpooledOperationIdException, rootcauseErrorEventId=0) 8DEE9220 [DM.Pipeline.Common.TracingTelemetryService] Event: FireActivityCompletedWithFailureEvent (duration=0, err=UnknownSpooledOperationIdException, rootcauseErrorEventId=0) 8F795B57 [DM.Pipeline.Diagnostics] Exception object created [IsBenign=True]: Microsoft.PowerBI.DataMovement.Pipeline.Diagnostics.UnknownSpooledOperationIdException: The spooled operation id 1a3f9c8a-41e6-4b55-9ce4-927a3c13f45f does not exist. Evict code: -1.; ErrorShortName: UnknownSpooledOperationIdException F7E3FFC3 [DM.GatewayCore] Error processing request: [0]Microsoft.PowerBI.DataMovement.Pipeline.Diagnostics.UnknownSpooledOperationIdException: The spooled operation id 1a3f9c8a-41e6-4b55-9ce4-927a3c13f45f does not exist. Evict code: -1.
Covering the world! 9:00-10:30 AM Sydney, 4:00-5:30 PM CET (Paris/Berlin), 7:00-8:30 PM Mexico City
Check out the April 2024 Power BI update to learn about new features.