- Power BI forums
- Updates
- News & Announcements
- Get Help with Power BI
- Desktop
- Service
- Report Server
- Power Query
- Mobile Apps
- Developer
- DAX Commands and Tips
- Custom Visuals Development Discussion
- Health and Life Sciences
- Power BI Spanish forums
- Translated Spanish Desktop
- Power Platform Integration - Better Together!
- Power Platform Integrations (Read-only)
- Power Platform and Dynamics 365 Integrations (Read-only)
- Training and Consulting
- Instructor Led Training
- Dashboard in a Day for Women, by Women
- Galleries
- Community Connections & How-To Videos
- COVID-19 Data Stories Gallery
- Themes Gallery
- Data Stories Gallery
- R Script Showcase
- Webinars and Video Gallery
- Quick Measures Gallery
- 2021 MSBizAppsSummit Gallery
- 2020 MSBizAppsSummit Gallery
- 2019 MSBizAppsSummit Gallery
- Events
- Ideas
- Custom Visuals Ideas
- Issues
- Issues
- Events
- Upcoming Events
- Community Blog
- Power BI Community Blog
- Custom Visuals Community Blog
- Community Support
- Community Accounts & Registration
- Using the Community
- Community Feedback
Register now to learn Fabric in free live sessions led by the best Microsoft experts. From Apr 16 to May 9, in English and Spanish.
- Power BI forums
- Forums
- Get Help with Power BI
- Service
- Bar charts apparently reverting to US date format ...
- Subscribe to RSS Feed
- Mark Topic as New
- Mark Topic as Read
- Float this Topic for Current User
- Bookmark
- Subscribe
- Printer Friendly Page
- Mark as New
- Bookmark
- Subscribe
- Mute
- Subscribe to RSS Feed
- Permalink
- Report Inappropriate Content
Bar charts apparently reverting to US date format when dataset is refreshed in workspace
Hi guys.
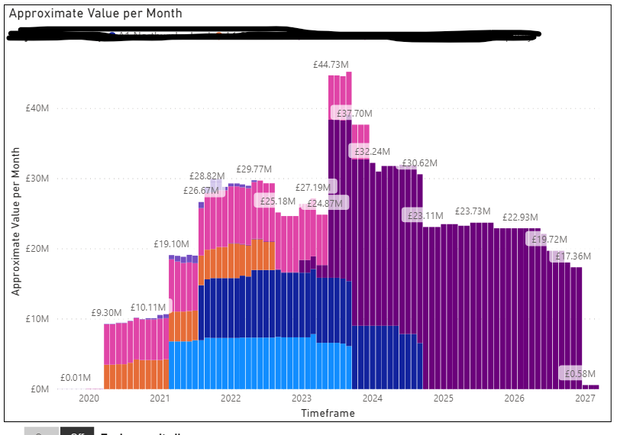
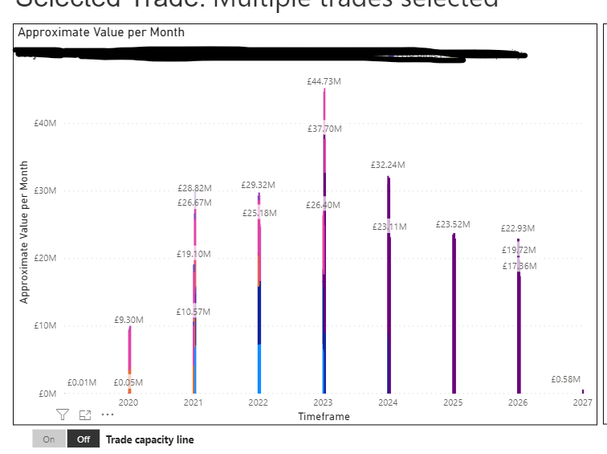
This is something I've never seen before in many years of publishing reports, and it doesn't seem to make much sense. A colleague alerted me to the fact that when a particular report is published to a workspace, and its dataset refreshed, any bar graphs in the report then seem to revert to a US date format (we're UK-based). The rest of the report seems to remain in UK date format.
Here's how one of the bar charts should look. The x-axis displays a bar for each month:
It stays this way when published to a workspace, but when its dataset is refreshed in the online interface, it becomes this:
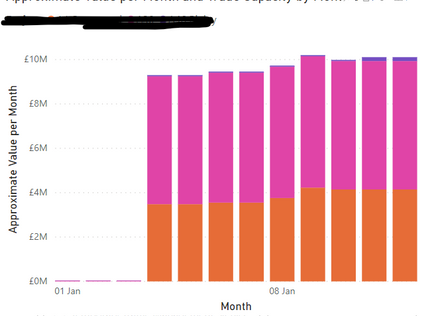
While troubleshooting, I zoomed in one of the tiny bars displayed here and discovered that it is actually presenting a bar for each day of January up until the 12th day. This leads me to believe that the online interface is for some reason processing the x-axis in US date format (UK February 1st becomes US January 2nd, for example):
The values correlate (what is being displayed as January 2nd here correlates to what it should be showing for February 1st), so it seems like I'm onto something.
Another fascination is that while this UK/US date confusion seems to be the issue, other visuals on the report retain their UK date format when the dataset is refreshed:
One thing that didn't work: grouping my months
My date values for the "month" column contain an arbitrary day value (01/01/2020 rather than 01/2020), because I'm pretty sure you have to have a day value for a date column in Power BI. I thought I could maybe circumvent this by creating a month group using the "group" feature to remove the day values entirely. When I use month "groups" for the x-axis instead, the report publishes normally once again, but when the dataset is refreshed, it becomes this:
I'm pretty clueless as to why this is. It seems to only be able to find one value per year.
A few other things of note:
- My x-axis is not in date heirarchy mode. That doesn't work as an option because I have too many month values to display in that view, and they extend off the page.
- My computer, browser(s) and Microsoft account are all set to UK date format.
- I originally had the new zoom sliders feature enabled for graphs in this report. I found that they were causing some visual bugs in the data when published, so I disabled them. I even rebuilt my graph from scratch while troubleshooting this to see whether that might have been the cause. Has anyone heard of the zoom sliders causing permanent issues with reports? I know I'm clutching at straws here.
TLDR:
My UK-date-format report's bar charts seem to change to US date format when the dataset is refreshed in the online interface. The rest of the report remains in UK date format.
I would much appreciate any suggestions or advice, as this one has me stumped. Thanks!
Solved! Go to Solution.
- Mark as New
- Bookmark
- Subscribe
- Mute
- Subscribe to RSS Feed
- Permalink
- Report Inappropriate Content
For anyone interested, I managed to solve this myself by changing the file's regional settings to US.
- Mark as New
- Bookmark
- Subscribe
- Mute
- Subscribe to RSS Feed
- Permalink
- Report Inappropriate Content
For anyone interested, I managed to solve this myself by changing the file's regional settings to US.
Helpful resources

Microsoft Fabric Learn Together
Covering the world! 9:00-10:30 AM Sydney, 4:00-5:30 PM CET (Paris/Berlin), 7:00-8:30 PM Mexico City

Power BI Monthly Update - April 2024
Check out the April 2024 Power BI update to learn about new features.


