skip to main content
Power BI
    • What is Power BI
    • Why Power BI
    • Customer stories
    • Data visuals
    • Security
    • Power BI Desktop
    • Power BI Pro
    • Power BI Premium
    • Power BI Mobile
    • Power BI Embedded
    • Power BI Report Server
  • Pricing
    • Azure + Power BI
    • Microsoft 365 + Power BI
      • Energy
      • Healthcare
      • Manufacturing
      • Media
      • Retail
    • For analysts
    • For IT
      • Overview
      • Embedded analytics
      • Power BI visuals
      • Automation
      • Documentation
      • Community
    • Overview
    • Find consulting services
    • Partner showcase
    • Find a partner
    • Become a partner
    • Instructor-led training
    • Getting started
      • Overview
      • Online workshops
      • Self-guided learning
      • Webinars
      • Documentation
      • Roadmap
      • Overview
      • Issues
      • Give feedback
    • Blog
    • Business intelligence topics
    • Overview
    • Forums
    • Galleries
    • Submit ideas
    • Events
    • User groups
    • Community blog
    • Register
    • ·
    • Sign in
    • ·
    • Help
    Go To
    • Galleries
    • Community Connections & How-To Videos
    • COVID-19 Data Stories Gallery
    • Themes Gallery
    • Data Stories Gallery
    • R Script Showcase
    • Webinars and Video Gallery
    • Quick Measures Gallery
    • 2021 MSBizAppsSummit Gallery
    • 2020 MSBizAppsSummit Gallery
    • 2019 MSBizAppsSummit Gallery
    • Events
    cancel
    Turn on suggestions
    Auto-suggest helps you quickly narrow down your search results by suggesting possible matches as you type.
    Showing results for 
    Search instead for 
    Did you mean: 
    • Microsoft Power BI Community
    • Galleries
    • R Script Showcase
    New Message
    Options
    • Mark all as New
    • Mark all as Read
    • Float this item to the top
    • Subscribe
    • Bookmark
    • Subscribe to RSS Feed
    • Threaded format
    • Linear Format
    • Sort by Topic Start Date
    • « Previous
      • 1
      • 2
    • Next »
    Recently posted Featured Top Kudos
    View Video
    Motion Chart and 3D Cube in PowerBI
    boosalis
    
    0
    View Video
    South of France Restaurant Concentration - Choropleth Map
    Anonymous
    
    0
    View Video
    Não remover linhas duplicadas no Power BI usando R e deixar eixos dos histogramas invisíveis
    Anonymous
    
    0
    View Video
    descriptive statistics in R / Power Bi
    plaralema
    
    0
    View Video
    Connecting Wikidata to Power BI using R
    DataKnowledge
    
    2
    View Video
    COMPARTILHAR
    Anonymous
    
    0
    View Video
    Matrix Bubble Chart
    plainly
    
    0
    View Video
    R multiple visual in one: Regression Table and Boxplot
    Quentin
    
    0
    View Video
    Topic and Sentiment Analysis Chart
    SidMacherla
    
    0
    View Video
    Dot Plot Chart with line (gantt)
    DavisBI
    
    1
    View Video
    Process Mining with the bupaR library
    Michael_Mertens
    
    0
    View Video
    Sparklines in power bi Column under the Matrix visual
    v-nesaw
    
    0
    View Video
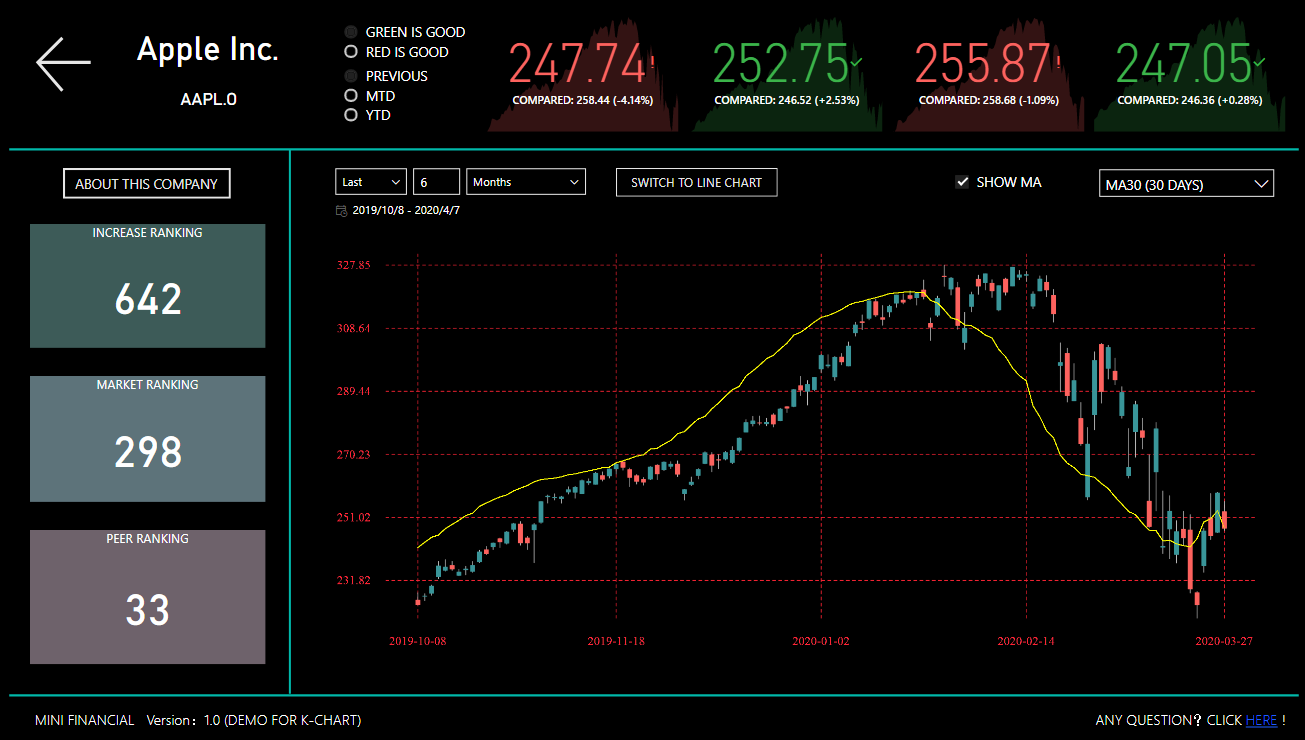
    SIMPLE K-CHART (Candlestick)
    DavisBI
    
    5
    View Video
    Inverted Y Axis with Constants
    RyanBentham
    
    0
    View Video
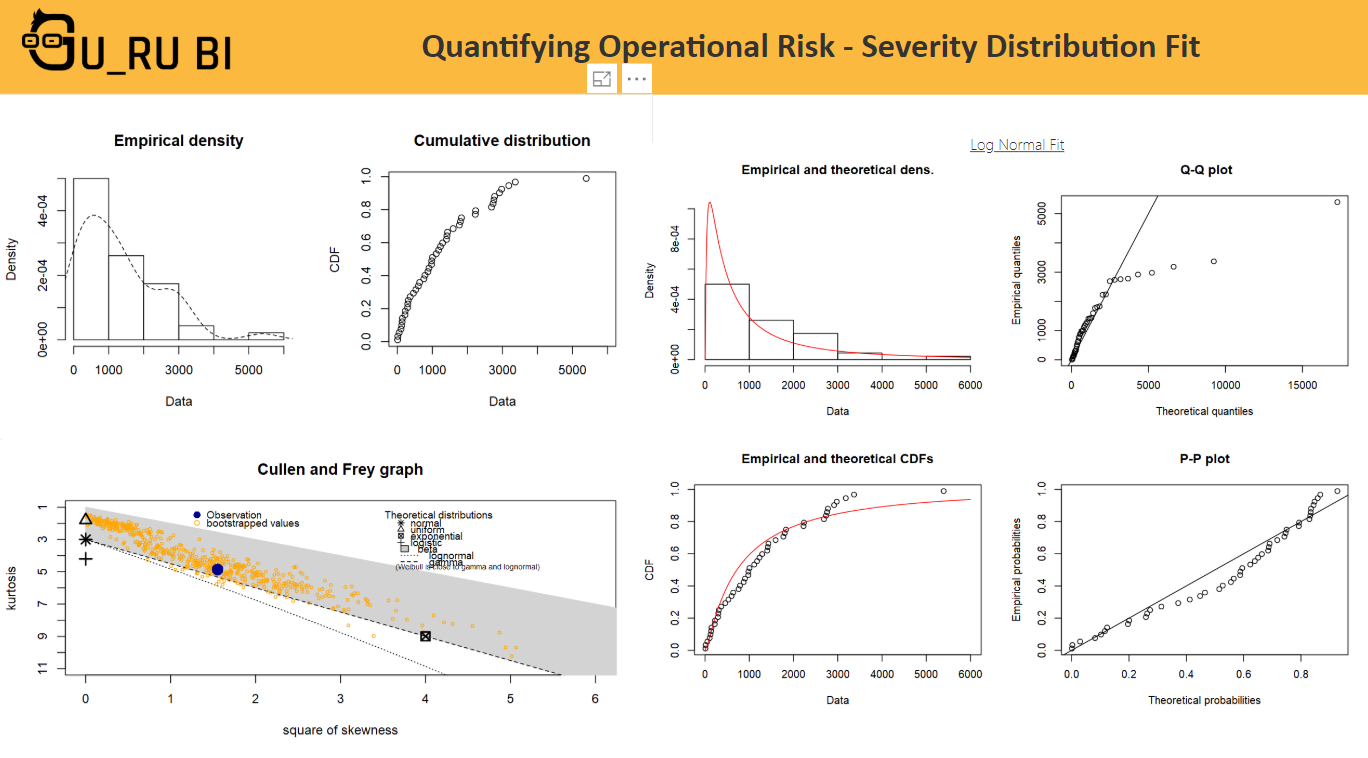
    Quantifying Operational Risk - Severity Distribution Fit
    guru_bi
    
    3
    View Video
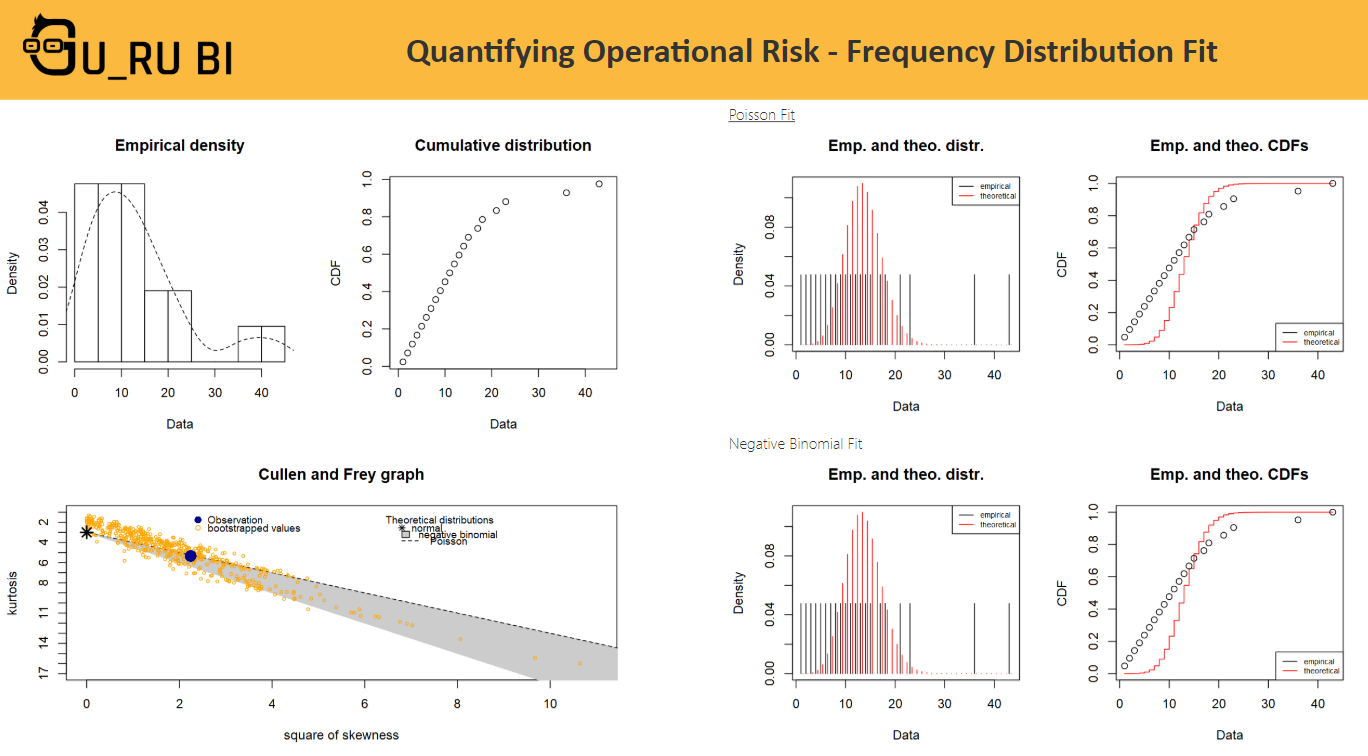
    Quantifying Operational Risk - Frequency Distribution Fitting
    guru_bi
    
    0
    View Video
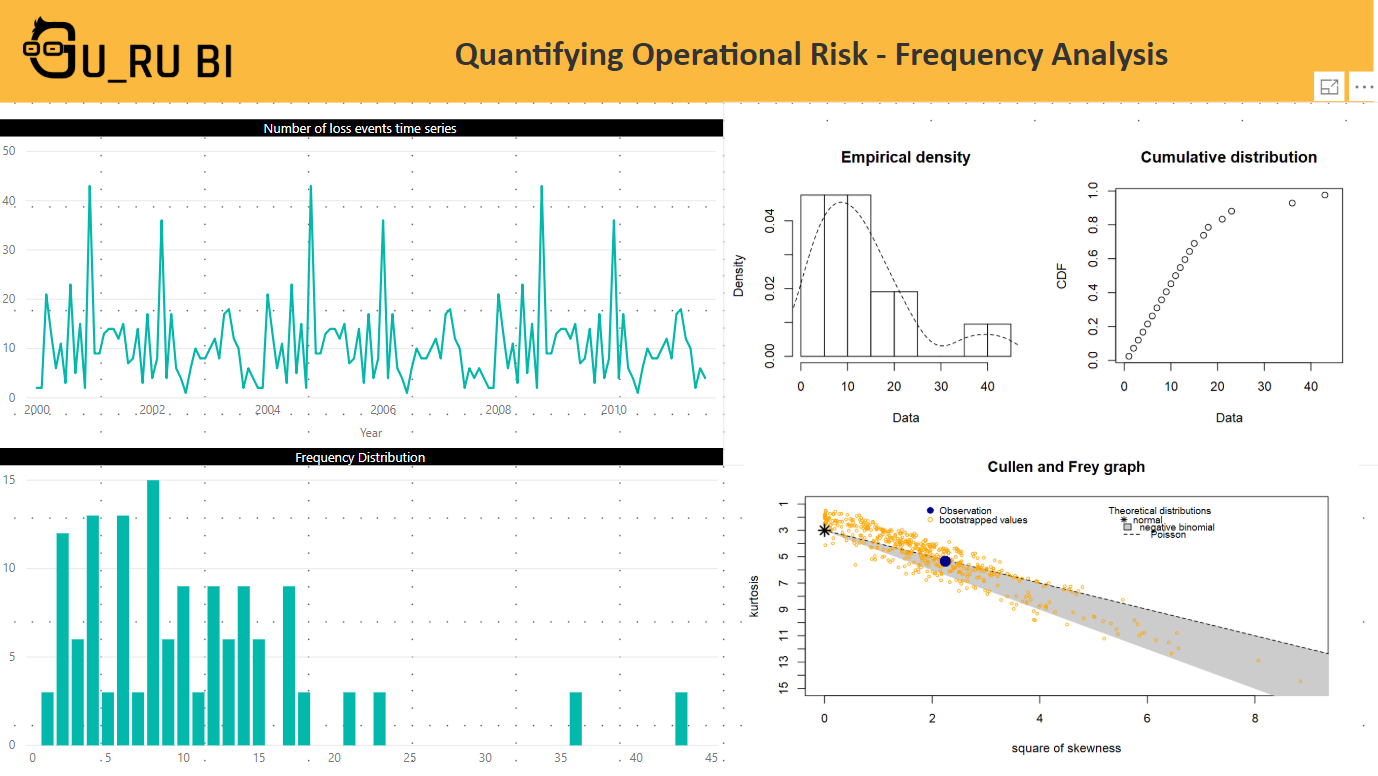
    Quantifying Operational Risk - Frequency Analysis
    guru_bi
    
    0
    View Video
    R packages
    almartinezos
    
    1
    View Video
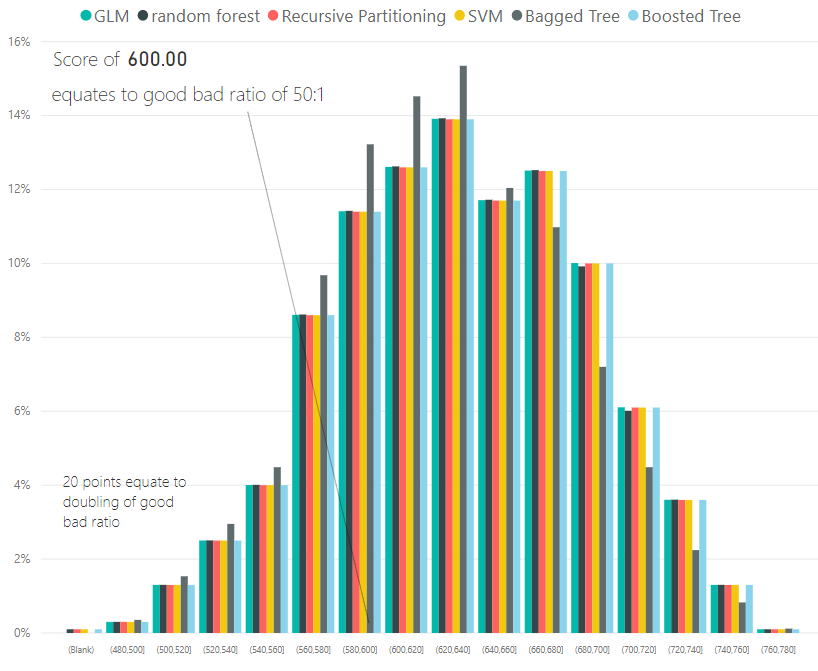
    Machine Learning + Score Calibration with R and Power BI
    guru_bi
    
    0
    View Video
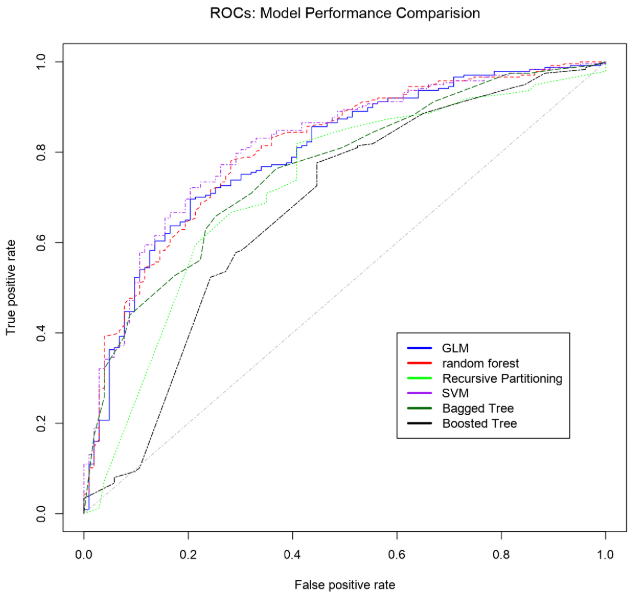
    Machine Learning + Model Evaluation
    guru_bi
    
    0
    View Video
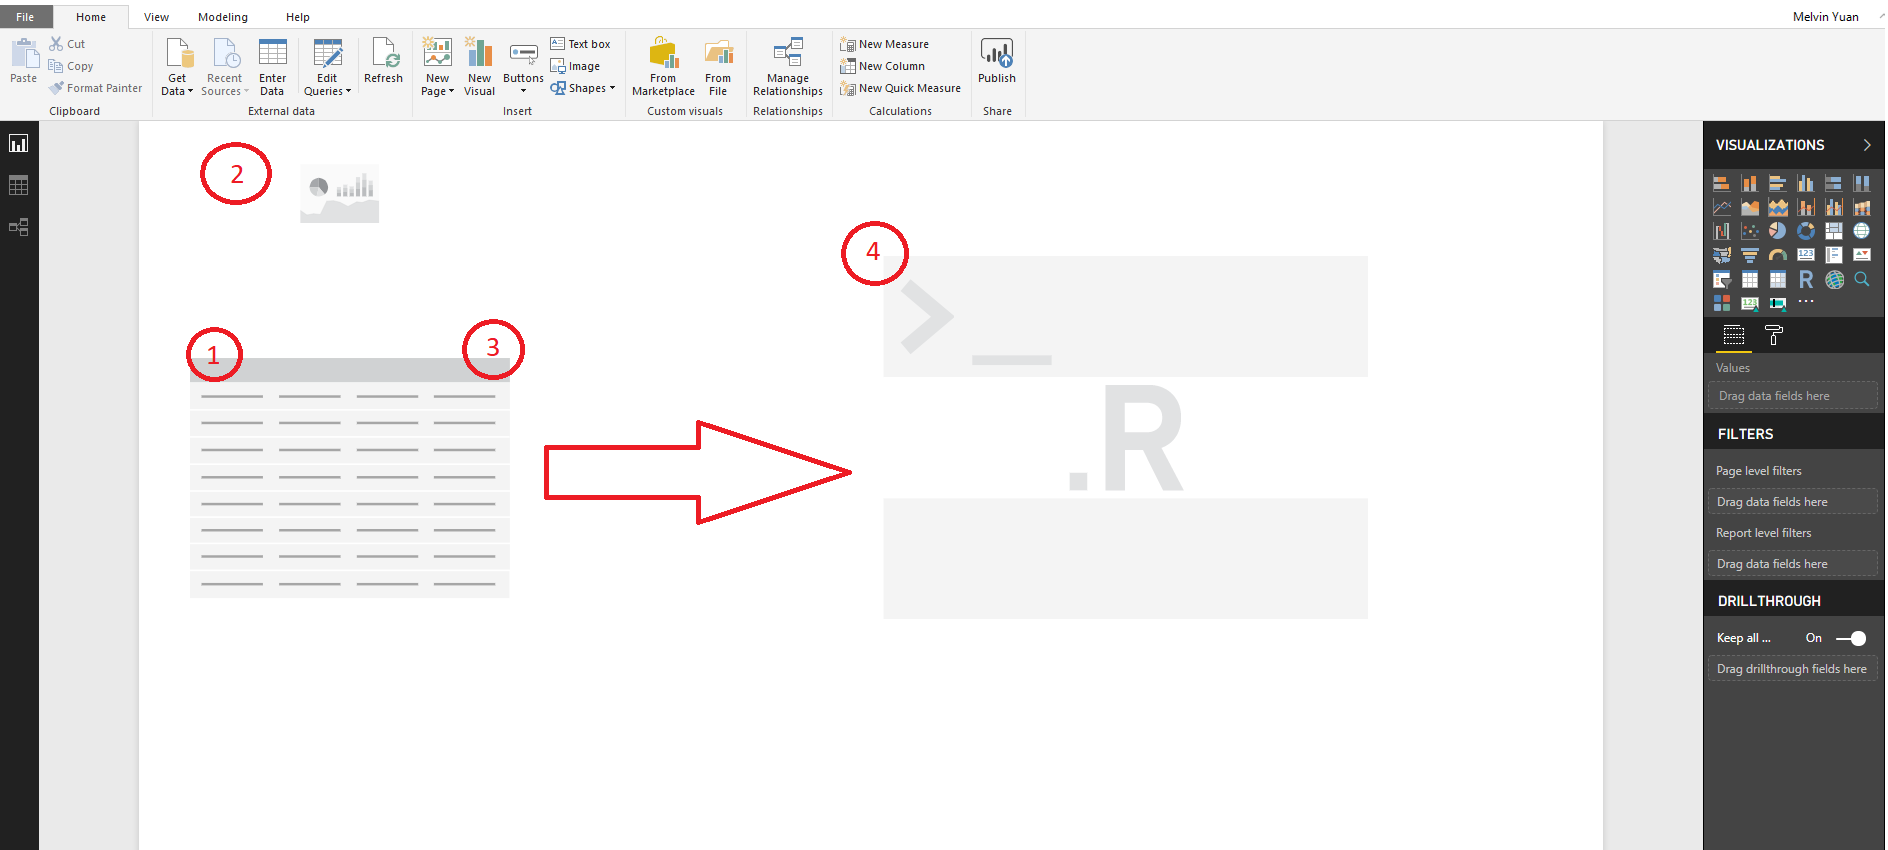
    filter data and use in r
    Melvvvyyy
    
    0
    View Video
    Funnel plot + online tutorial for R and Custom R Visuals
    boefraty
    
    1
    View Video
    Dumbbell Chart by MAQ Software
    MAQPowerBI
    
    1
    View Video
    Slope Chart by MAQ Software
    MAQPowerBI
    
    2
    View Video
    Dumbbell Chart by MAQ Software
    MAQPowerBI
    
    2
    View Video
    Utilization Chart in R
    Anonymous
    
    5
    View Video
    Correlation plot and tree model
    jgp
    
    2
    View Video
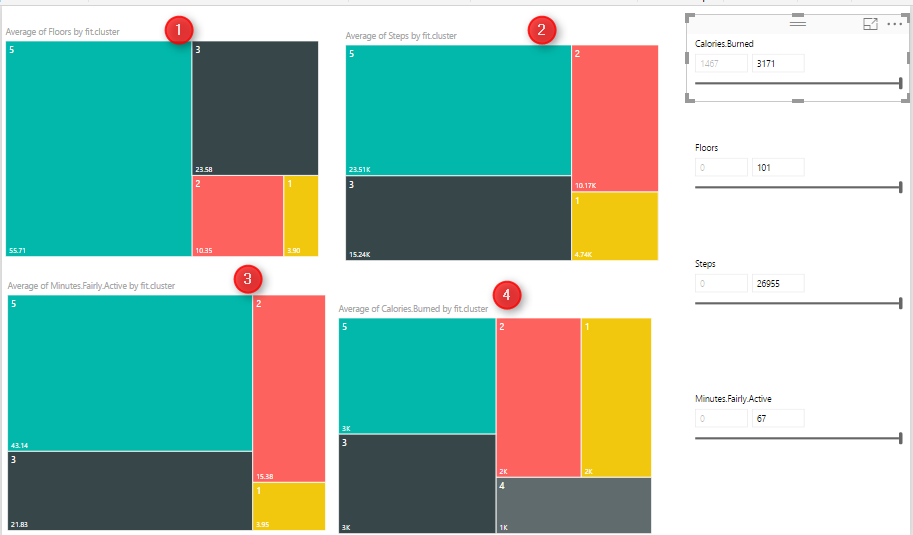
    Clustering using k-mean in power query, elbow chart
    leilaetaati
    
    2
    View Video
    Combined Line and Area chart in R
    ankitpatira
    
    3
    View Video
    Variable Width Column Chart
    leilaetaati
    
    1
    • « Previous
      • 1
      • 2
    • Next »

    Power Platform

    • Overview
    • Power BI
    • Power Apps
    • Power Pages
    • Power Automate
    • Power Virtual Agents

    • Sign in
    • Sign up

    Browse

    • Solutions
    • Partners
    • Consulting Services

    Downloads

    • Power BI Desktop
    • Power BI Mobile
    • Power BI Report Server
    • See all downloads

    Learn

    • Guided learning
    • Documentation
    • Support
    • Community
    • Give feedback
    • Webinars
    • Developers
    • Blog
    • Newsletter

    © 2023 Microsoft

    Follow Power BI

    • Privacy & cookies
    • Manage cookies
    • Terms of use
    • Trademarks
    California Consumer Privacy Act (CCPA) Opt-Out Icon Your California Privacy Choices