- Power BI forums
- Updates
- News & Announcements
- Get Help with Power BI
- Desktop
- Service
- Report Server
- Power Query
- Mobile Apps
- Developer
- DAX Commands and Tips
- Custom Visuals Development Discussion
- Health and Life Sciences
- Power BI Spanish forums
- Translated Spanish Desktop
- Power Platform Integration - Better Together!
- Power Platform Integrations (Read-only)
- Power Platform and Dynamics 365 Integrations (Read-only)
- Training and Consulting
- Instructor Led Training
- Dashboard in a Day for Women, by Women
- Galleries
- Community Connections & How-To Videos
- COVID-19 Data Stories Gallery
- Themes Gallery
- Data Stories Gallery
- R Script Showcase
- Webinars and Video Gallery
- Quick Measures Gallery
- 2021 MSBizAppsSummit Gallery
- 2020 MSBizAppsSummit Gallery
- 2019 MSBizAppsSummit Gallery
- Events
- Ideas
- Custom Visuals Ideas
- Issues
- Issues
- Events
- Upcoming Events
- Community Blog
- Power BI Community Blog
- Custom Visuals Community Blog
- Community Support
- Community Accounts & Registration
- Using the Community
- Community Feedback
Register now to learn Fabric in free live sessions led by the best Microsoft experts. From Apr 16 to May 9, in English and Spanish.
- Power BI forums
- Galleries
- R Script Showcase
- Re: Venn Diagram


- Mark as New
- Bookmark
- Subscribe
- Mute
- Subscribe to RSS Feed
- Permalink
- Report Inappropriate Content
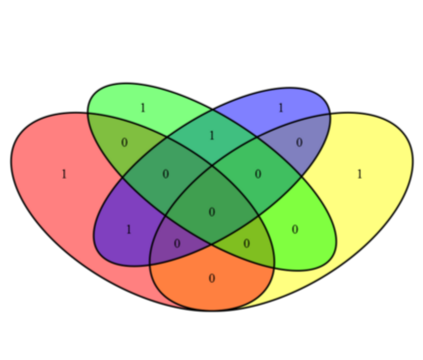
Venn Diagram
Venn diagrams show overlapping regions based on values within sets. The R visualization code provided in this Power BI desktop file will take a dynamic set of columns (based on the values you add in the fields pane), perform the overlap analysis, and display the diagram. This code will work with up to 5 columns.
Prerequisites (The sample .pbix files will not work without these prerequites completed)
- Install R Engine: Power BI Desktop does not include, deploy or install the R engine. To run R scripts in Power BI Desktop, you must separately install R on your local computer. You can download and install R for free from many locations, including the Revolution Open download page, and the CRAN Repository
- Install the required R packages: VennDiagram
- Mark as New
- Bookmark
- Subscribe
- Mute
- Subscribe to RSS Feed
- Permalink
- Report Inappropriate Content
Hi @spotpuff
The code uses the VennDiagram package, check their documentation.
Can I get the PBIX with exact R code and data which you use for testing ?
- Mark as New
- Bookmark
- Subscribe
- Mute
- Subscribe to RSS Feed
- Permalink
- Report Inappropriate Content
Dear Boefraty,
I got it to work! Thanks so much. You have been amazing. I truly appreciate your help and your patience.
Thanks again,
Juniper
- Mark as New
- Bookmark
- Subscribe
- Mute
- Subscribe to RSS Feed
- Permalink
- Report Inappropriate Content
Hi Boefraty,
That's so strange. My file on this end says "don't summarize" is selected. Your code won't run because it doesn't like the (perfectly good) file path, and it says duplicate rows have been removed from the data, which isn't supposed to happen.
Many thanks,
Jennifer
- Mark as New
- Bookmark
- Subscribe
- Mute
- Subscribe to RSS Feed
- Permalink
- Report Inappropriate Content
You are reading input from exel file, ignoring the input from PBI report 🙂
#Comment out this line
#Venn <- read.xlsx("Venn.xlsx", sheetName = "Venn", header = TRUE, stringsAsFactors = FALSE)
#Use this one instead
Venn = dataset
I'd also recommend to clean the R code from loading unnecessary libraries (rJava etc.)
Good luck with your project 🙂
- Mark as New
- Bookmark
- Subscribe
- Mute
- Subscribe to RSS Feed
- Permalink
- Report Inappropriate Content
Hi Jessica,
Thank you for the R script.
However, for my requirement when I add a 5th column, the labels get truncated. Do you have any suggestion so as to how we can overcome that?
I've attached your file with my modifications to show you the problem I'm facing.
Thanks
Mark
- Mark as New
- Bookmark
- Subscribe
- Mute
- Subscribe to RSS Feed
- Permalink
- Report Inappropriate Content
Try changing parameters of
venn.diagram
For example margin:
venndiagram <- venn.diagram(listdataset, filename=NULL, na="remove", fill = listcolor, margin = 0.1)
- Mark as New
- Bookmark
- Subscribe
- Mute
- Subscribe to RSS Feed
- Permalink
- Report Inappropriate Content
Thanks!
- Mark as New
- Bookmark
- Subscribe
- Mute
- Subscribe to RSS Feed
- Permalink
- Report Inappropriate Content
How can i create venn diagram without using R? Please help me
- Mark as New
- Bookmark
- Subscribe
- Mute
- Subscribe to RSS Feed
- Permalink
- Report Inappropriate Content
Hi Jessica,
Thanks for this wonderful R-showcase. If you consider to convert this or one of your future R-visuals to R-powered-custom visuals, out team will be happy to assist you.
The visibility of R-powered custom visuals is greater and it is not limited for R-users.