- Power BI forums
- Updates
- News & Announcements
- Get Help with Power BI
- Desktop
- Service
- Report Server
- Power Query
- Mobile Apps
- Developer
- DAX Commands and Tips
- Custom Visuals Development Discussion
- Health and Life Sciences
- Power BI Spanish forums
- Translated Spanish Desktop
- Power Platform Integration - Better Together!
- Power Platform Integrations (Read-only)
- Power Platform and Dynamics 365 Integrations (Read-only)
- Training and Consulting
- Instructor Led Training
- Dashboard in a Day for Women, by Women
- Galleries
- Community Connections & How-To Videos
- COVID-19 Data Stories Gallery
- Themes Gallery
- Data Stories Gallery
- R Script Showcase
- Webinars and Video Gallery
- Quick Measures Gallery
- 2021 MSBizAppsSummit Gallery
- 2020 MSBizAppsSummit Gallery
- 2019 MSBizAppsSummit Gallery
- Events
- Ideas
- Custom Visuals Ideas
- Issues
- Issues
- Events
- Upcoming Events
- Community Blog
- Power BI Community Blog
- Custom Visuals Community Blog
- Community Support
- Community Accounts & Registration
- Using the Community
- Community Feedback
Register now to learn Fabric in free live sessions led by the best Microsoft experts. From Apr 16 to May 9, in English and Spanish.
- Power BI forums
- Galleries
- R Script Showcase
- Map with connecting lines


- Mark as New
- Bookmark
- Subscribe
- Mute
- Subscribe to RSS Feed
- Permalink
- Report Inappropriate Content
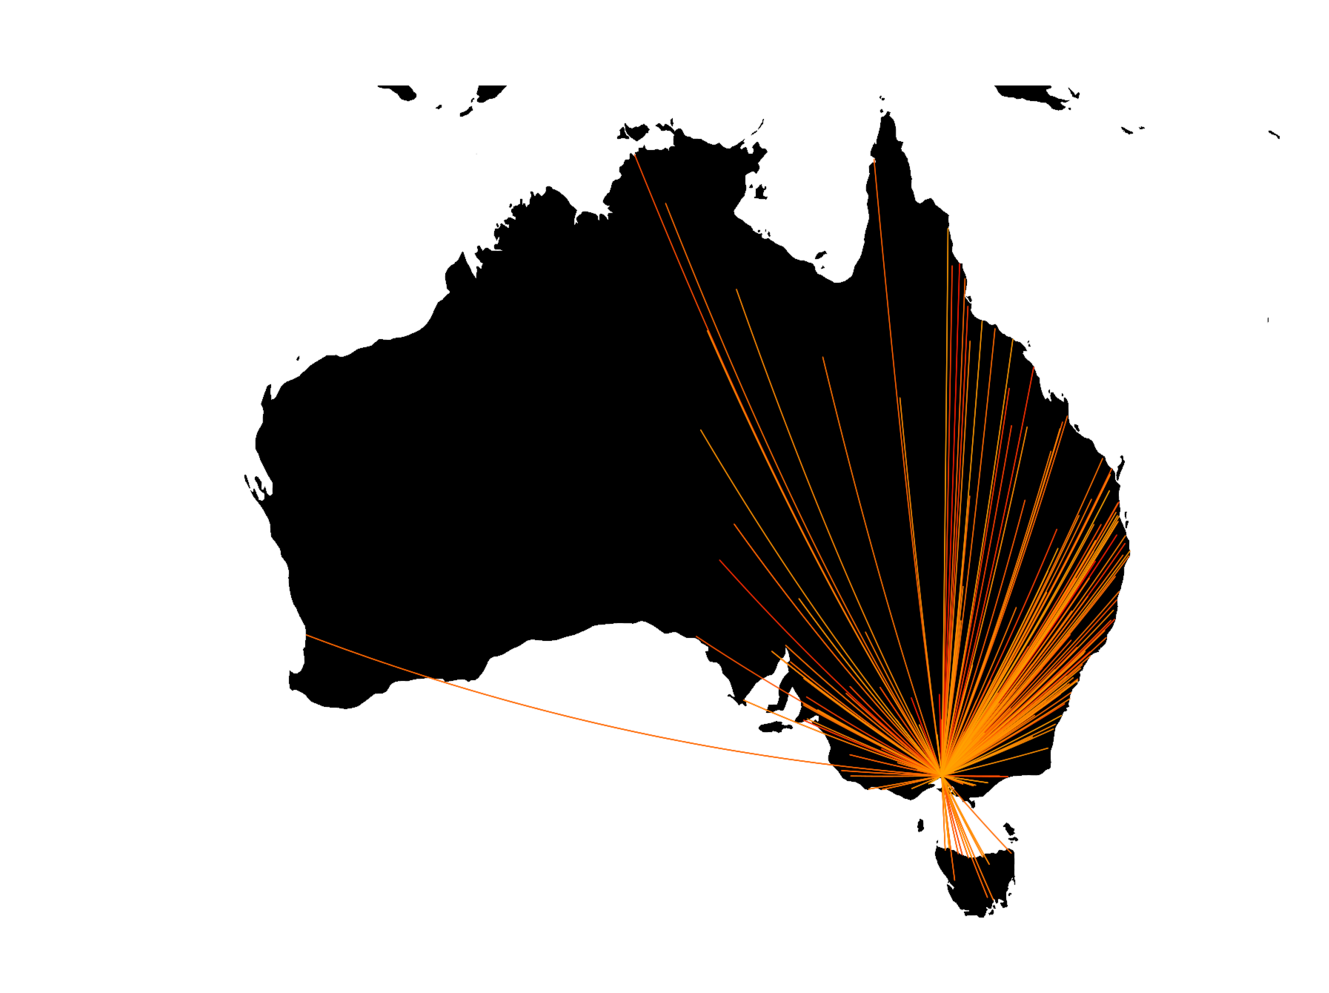
Map with connecting lines
Description
This visual uses Maps package and Geosphere package to draw a map of Australia and dots on that map finally connecting them with lines. Using sample migration statistics data from different cities within Australia to the city of Melbourne, R visual shows the trend of migration by color coding the lines and shading higher count cities on top of the lower ones.
Prerequisites (The sample .pbix files won't work without installing the following)
1. Install R Engine
Power BI does not include the R engine. Therefore, a seperate installation is required to install R on your local computer.
Required R Packages
Maps
Geosphere
Tested on
MRO 3.3.1, CRAN 3.3.1
- Mark as New
- Bookmark
- Subscribe
- Mute
- Subscribe to RSS Feed
- Permalink
- Report Inappropriate Content
Could you also add the Get Data R Script support files (Cities.csv, migrations.csv).
- Mark as New
- Bookmark
- Subscribe
- Mute
- Subscribe to RSS Feed
- Permalink
- Report Inappropriate Content
Could you please include the files used in R Get Data Script.
Cities.csv, migrations.csv
- Mark as New
- Bookmark
- Subscribe
- Mute
- Subscribe to RSS Feed
- Permalink
- Report Inappropriate Content
To get this R visual script to work, users will need to add the following commands before the two libray function calls:
install.packages("maps")
install.packages("geosphere")
- Mark as New
- Bookmark
- Subscribe
- Mute
- Subscribe to RSS Feed
- Permalink
- Report Inappropriate Content
Hi Ankitpatira,
thanks for the visual. Really great one.
Hi Paul,
Can we install these packages before even having R installed? and sorry for the question but... how do we install packages?
thanks for your help
/Jose Miguel
- Mark as New
- Bookmark
- Subscribe
- Mute
- Subscribe to RSS Feed
- Permalink
- Report Inappropriate Content
Hi @JoseMiguelPR,
You need R engine installed to run R in Power BI. You can use any R IDE (like RStudio) to install packages
See more here:
https://powerbi.microsoft.com/en-us/documentation/powerbi-desktop-r-scripts/
- Mark as New
- Bookmark
- Subscribe
- Mute
- Subscribe to RSS Feed
- Permalink
- Report Inappropriate Content
Hi Ankit,
This visual is very impressive. If you consider to convert this or some of your other R-visuals to R-powered-custom visuals, out team will be happy to assist you.
The visibility of R-powered custom visuals is greater and it is not limited for R-users.
- Mark as New
- Bookmark
- Subscribe
- Mute
- Subscribe to RSS Feed
- Permalink
- Report Inappropriate Content
this is so cool Ankit!