- Power BI forums
- Updates
- News & Announcements
- Get Help with Power BI
- Desktop
- Service
- Report Server
- Power Query
- Mobile Apps
- Developer
- DAX Commands and Tips
- Custom Visuals Development Discussion
- Health and Life Sciences
- Power BI Spanish forums
- Translated Spanish Desktop
- Power Platform Integration - Better Together!
- Power Platform Integrations (Read-only)
- Power Platform and Dynamics 365 Integrations (Read-only)
- Training and Consulting
- Instructor Led Training
- Dashboard in a Day for Women, by Women
- Galleries
- Community Connections & How-To Videos
- COVID-19 Data Stories Gallery
- Themes Gallery
- Data Stories Gallery
- R Script Showcase
- Webinars and Video Gallery
- Quick Measures Gallery
- 2021 MSBizAppsSummit Gallery
- 2020 MSBizAppsSummit Gallery
- 2019 MSBizAppsSummit Gallery
- Events
- Ideas
- Custom Visuals Ideas
- Issues
- Issues
- Events
- Upcoming Events
- Community Blog
- Power BI Community Blog
- Custom Visuals Community Blog
- Community Support
- Community Accounts & Registration
- Using the Community
- Community Feedback
Register now to learn Fabric in free live sessions led by the best Microsoft experts. From Apr 16 to May 9, in English and Spanish.
- Power BI forums
- Galleries
- R Script Showcase
- Forecasting


- Mark as New
- Bookmark
- Subscribe
- Mute
- Subscribe to RSS Feed
- Permalink
- Report Inappropriate Content
Forecasting

Prerequisites (The sample .pbix files will not work without these prerequites completed)
1. Install R Engine
Power BI Desktop does not include, deploy or install the R engine. To run R scripts in Power BI Desktop, you must separately installR on your local computer. You can download and install R for free from many locations, including the Revolution Open download page, and the CRAN Repository.
2. Install the required R packages.
Download the R script attached to this message and run it to install all required packages on your local machine.
Required R packages:
forecast, graphics, scales, zoo
Tested on:
CRAN 3.3.1, MRO 3.3.0, powerbi.com
Legal Disclaimers:
Terms of Service and Third Party Programs.
- Mark as New
- Bookmark
- Subscribe
- Mute
- Subscribe to RSS Feed
- Permalink
- Report Inappropriate Content
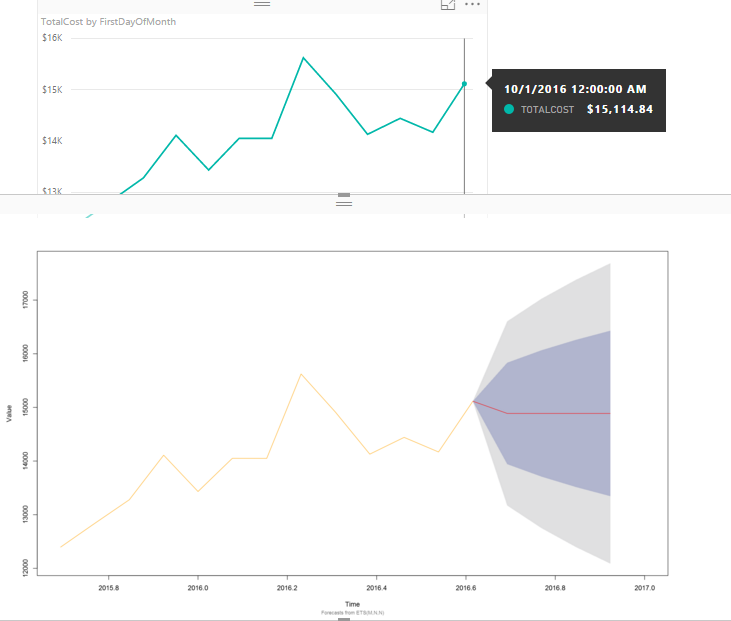
I copied the Power BI page, and replaced the R visual with a trend line using the forecasting functionality in the Analytics (second image). After removing the date hierarchy setting from the x-axis - the forecasts look similar.
Filtered for U.S.

- Mark as New
- Bookmark
- Subscribe
- Mute
- Subscribe to RSS Feed
- Permalink
- Report Inappropriate Content
is it possible to plot one forecasted series and one actual values series on the same chart? It doesn't seem like Power BI's built-in visual supports this, but maybe an R-visual would.
- Mark as New
- Bookmark
- Subscribe
- Mute
- Subscribe to RSS Feed
- Permalink
- Report Inappropriate Content
The built-in forecast feature does include the option to include actual side-by-side with projections.
Does anyone know if the engince that drives analytics is any different from R? The results look the same, so it would appear not.


- Mark as New
- Bookmark
- Subscribe
- Mute
- Subscribe to RSS Feed
- Permalink
- Report Inappropriate Content
No, this is what I'm saying. For the built-in visual, the forecast option is only present when one series is plotted.


- Mark as New
- Bookmark
- Subscribe
- Mute
- Subscribe to RSS Feed
- Permalink
- Report Inappropriate Content
A work around is to overlap two individual charts - below you will see forecast for Sales and Product Cost from Adventure works. However, the legend is lost as each chart only has one variable.
A trade-off with R charts I have noticed is that slicers do not apply to the chart. Has that changed?

- Mark as New
- Bookmark
- Subscribe
- Mute
- Subscribe to RSS Feed
- Permalink
- Report Inappropriate Content
I did try this approach of using overlapping charts, but that doesn't work either. What I want to do is to plot one forecast series and one actual series on the same (or overlapping) chart. But the problem is that after I add a second series to the same line chart, the forecasting disappears. In my chart, I'm trying to plot the actuals from January 2016 to December 2016; the other series from January 2017 to December 2017. So the x-axis should be the same for both series, and this is why I need one actual and one forecast series. Make sense?
Another problem with overlapping is that tooltips will not work on the chart in back.
Yes, slicers do definitely apply to R visuals if that is what you're asking. Not sure though if it's possible to plot one actual and one forecast series on the same chart.
- Mark as New
- Bookmark
- Subscribe
- Mute
- Subscribe to RSS Feed
- Permalink
- Report Inappropriate Content
- Mark as New
- Bookmark
- Subscribe
- Mute
- Subscribe to RSS Feed
- Permalink
- Report Inappropriate Content
Hi there!
First of all, awesome visual! It took me a week to script the ets forecasting in R on my data, and I've been able to get what I want, but then the problem is that it generates a completely new set of data, unrealted to the existing model in Power BI. Your visual solves this problem by integrating the R script (very similar to what I have) into Power BI, so now I can use measures. Great work.
Afew things missing here: the Y-axis is poorly marked, if we're talking about millions of dollars on the Y axis. Also, no labels. So, I decided to clone this visual and create my small variation. Standing on the shoulders of giants, as they say
All I've done so far is adjusted the R script to also populate a table of values along with the graph. I left the rest untouched.
I got to the point that suits me for now (I hope to keep improving) and I can see needed results on the web when I run pbiviz start command.

But when I try to package the visual, the packaged custom visual for PBI Desktop doesn't have any of those changes... What am I doing wrong?

- Mark as New
- Bookmark
- Subscribe
- Mute
- Subscribe to RSS Feed
- Permalink
- Report Inappropriate Content
You didn't call "pbiviz new" command, instead you are updating the existing one. So you'll need to do two things:
1) change "guid" field inside "pbiviz.json" to be different string
2) call "pbiviz package" command from command line ( inside the folder of visual)
See more here
https://github.com/Microsoft/PowerBI-visuals/tree/master/RVisualTutorial
- Mark as New
- Bookmark
- Subscribe
- Mute
- Subscribe to RSS Feed
- Permalink
- Report Inappropriate Content
Hi,
I am fairly new to Power BI and don't know a lot about R scripting yet. I downloaded the file, but it gives me an error in the left visual: there is no package called 'scales'. I also downloaded the R script that I assume installs these packages. But how do I run the script to create them?
I am using C:\Program Files\Microsoft\MRO-3.3.2 as my home directory and Visual Studio 2015 as my R IDE.
- Mark as New
- Bookmark
- Subscribe
- Mute
- Subscribe to RSS Feed
- Permalink
- Report Inappropriate Content
I ran into this same problem initially. What you have to do to fix:
Update R for Windows from the R Script command line:
if(!require(installr)) {
install.packages("installr"); require(installr))
It will tell you you're using 3.3.2, but the latest version is 3.3.3. To update, run this command:
updateR()
Then open MRO 3.3.3 and load the scales package:
This should install the zoo and forecast package for you, but if it doesn't manually install these packages from the screenshot above.
- Mark as New
- Bookmark
- Subscribe
- Mute
- Subscribe to RSS Feed
- Permalink
- Report Inappropriate Content
I sent a reply to private mail. Hopefully it helps...
In general to install missing package you need to type install.packages("scales") from any R command line (R studio or VS IDE). Alernatively, you run the script.
See
https://powerbi.microsoft.com/en-us/documentation/
Scroll down till you see:
"Install R packages manually, using any R console"
- Mark as New
- Bookmark
- Subscribe
- Mute
- Subscribe to RSS Feed
- Permalink
- Report Inappropriate Content
Thanks for the great visual.
I am getting weird x Axis (date) labels. 2016.2, 2016.4 and they don't seem to line up with February 2016 and April 2016. Attached is a png image of what i am seeing. I also included a standard pbi visual to show the correct dates.
Am I missing a formatting option?
- Mark as New
- Bookmark
- Subscribe
- Mute
- Subscribe to RSS Feed
- Permalink
- Report Inappropriate Content
Attached is a copy of the actual data used in the original births.csv file which I obtained from the pbix.
I got this by simply creating a new table on the report page, added all columns with no summarisation then used the export data option from that table.
As dates are exported from Power BI using a date-time format I used excel to reformat the Calendar Month column as just a date. I deliberately used a US format (mm//dd/yyyy) which might be more widely usable though this should automatically be recognised by Power BI anyway. If it is not and you use something different then just format in excel to suit your needs.
Obvioulsy this doesn't really gain you anything since the information was all already embedded in the pbix but it does allow you to fix the errors seen when looking at queries.
Of course, the technique is something that might be useful in other situations where you are missing a source file and want to recreate it so hopefully this helps someone.
(attached as a zip file since csv attachments are not supported on the forum)
- Mark as New
- Bookmark
- Subscribe
- Mute
- Subscribe to RSS Feed
- Permalink
- Report Inappropriate Content
This is great! Appreciate the time and effort it took to build and share this out!
I've been exploring the forecasting using the R integration and PowerBI, and was wondering if there was a way to explicitly show the predicted values and confidence intervals in a dynamic way. For example, in this situation, if I clicked on "Cuba" for this specific forecast example, how would I obtain the values shown in the R visualization on the Dashboard?
Thanks,
Ronnie
- Mark as New
- Bookmark
- Subscribe
- Mute
- Subscribe to RSS Feed
- Permalink
- Report Inappropriate Content
When running the ScriptInstallPackagesForForecast.R script, I'm getting the following warnings:
-package ‘forecast’ was built under R version 3.3.1
-package ‘zoo’ was built under R version 3.3.1
What should I do to solve those warnings ?
- Mark as New
- Bookmark
- Subscribe
- Mute
- Subscribe to RSS Feed
- Permalink
- Report Inappropriate Content
@stlecho, nothing, it works with this warnings too
excel-inside.pro
- Mark as New
- Bookmark
- Subscribe
- Mute
- Subscribe to RSS Feed
- Permalink
- Report Inappropriate Content
When running the ScriptInstallPackagesForForecast.R script, I'm getting the following warnings:
1: package 'forecast' was built under R version 3.3.1
2: package 'zoo' was built under R version 3.3.1
How can this be solved please ?
- Mark as New
- Bookmark
- Subscribe
- Mute
- Subscribe to RSS Feed
- Permalink
- Report Inappropriate Content
Hi, great piece of software,
All other models work, except this one, probably with the ts code part.
Posting the error message file here:
Error Message:
Erro de script do R.
Loading required package: scales
Loading required package: forecast
Loading required package: zoo
Attaching package: 'zoo'
The following objects are masked from 'package:base':
as.Date, as.Date.numeric
Loading required package: timeDate
Loading required package: methods
This is forecast 7.1
Error in if (frequency > 1 && abs(frequency - round(frequency)) < ts.eps) frequency <- round(frequency) :
missing value where TRUE/FALSE needed
Calls: ts
Execution halted
Stack Trace:
Invocation Stack Trace:
ID de atividade
e5ab37b4-ff68-4eeb-9ac7-d3cc346b8037
Hora
Fri Aug 19 2016 00:14:08 GMT+0100 (Hora de Verão de GMT)
Versão
2.37.4464.361 (PBIDesktop)
Client Error Code
ServiceErrorToClientError
Error Details
Erro de script do R.
Loading required package: scales
Loading required package: forecast
Loading required package: zoo
Attaching package: 'zoo'
The following objects are masked from 'package:base':
as.Date, as.Date.numeric
Loading required package: timeDate
Loading required package: methods
This is forecast 7.1
Error in if (frequency > 1 && abs(frequency - round(frequency)) < ts.eps) frequency <- round(frequency) :
missing value where TRUE/FALSE needed
Calls: ts
Execution halted
Stack Trace
Microsoft.PowerBI.ExploreServiceCommon.ScriptHandlerException: Erro de script do R.
Loading required package: scales
Loading required package: forecast
Loading required package: zoo
Attaching package: 'zoo'
The following objects are masked from 'package:base':
as.Date, as.Date.numeric
Loading required package: timeDate
Loading required package: methods
This is forecast 7.1
Error in if (frequency > 1 && abs(frequency - round(frequency)) < ts.eps) frequency <- round(frequency) :
missing value where TRUE/FALSE needed
Calls: ts
Execution halted
---> Microsoft.PowerBI.Radio.RScriptRuntimeException: Erro de script do R.
Loading required package: scales
Loading required package: forecast
Loading required package: zoo
Attaching package: 'zoo'
The following objects are masked from 'package:base':
as.Date, as.Date.numeric
Loading required package: timeDate
Loading required package: methods
This is forecast 7.1
Error in if (frequency > 1 && abs(frequency - round(frequency)) < ts.eps) frequency <- round(frequency) :
missing value where TRUE/FALSE needed
Calls: ts
Execution halted
em Microsoft.PowerBI.Radio.RScriptWrapper.RunScript(String originalScript, Int32 timeoutMs)
em Microsoft.PowerBI.Client.Windows.R.RScriptHandler.GenerateVisual(String script, String inputVariableName, IDataReader dataReader, Nullable`1 viewportWidthPx, Nullable`1 viewportHeightPx)
--- Fim do rastreio da pilha de excepção interna ---
em Microsoft.PowerBI.Client.Windows.R.RScriptHandler.GenerateVisual(String script, String inputVariableName, IDataReader dataReader, Nullable`1 viewportWidthPx, Nullable`1 viewportHeightPx)
em Microsoft.PowerBI.ExploreServiceCommon.ScriptVisualCommandFlow.RunInternal(Stream dataShapeResultStream, QueryBindingDescriptor& bindingDescriptor)
em Microsoft.PowerBI.ExploreServiceCommon.ScriptVisualCommandFlow.Run(Stream dataShapeResultStream, QueryBindingDescriptor& bindingDescriptor)
em Microsoft.PowerBI.ExploreHost.SemanticQuery.ExecuteSemanticQueryFlow.TransformDataShapeResult(QueryCommand transformCommand, String dataShapeId, SemanticQueryDataShapeCommand command, Stream dataShapeResultStream, QueryBindingDescriptor& bindingDescriptor)
em Microsoft.PowerBI.ExploreHost.SemanticQuery.ExecuteSemanticQueryFlow.ProcessAndWriteDataQuery(IQueryResultDataWriter queryResultDataWriter, DataShapeGenerationContext dsqGenContext, EntityDataModel model, DataQuery query, ServiceErrorStatusCode& serviceErrorStatusCode)
em Microsoft.PowerBI.ExploreHost.SemanticQuery.ExecuteSemanticQueryFlow.ProcessAndWriteSemanticQueryCommands(IQueryResultsWriter queryResultsWriter, ExecuteSemanticQueryRequest request, IConceptualSchema conceptualSchema, EntityDataModel model)
If only one time series selected, visual does appear, but prediction model transforms into an useless predictive model.
Keep it up with the good work.