- Power BI forums
- Updates
- News & Announcements
- Get Help with Power BI
- Desktop
- Service
- Report Server
- Power Query
- Mobile Apps
- Developer
- DAX Commands and Tips
- Custom Visuals Development Discussion
- Health and Life Sciences
- Power BI Spanish forums
- Translated Spanish Desktop
- Power Platform Integration - Better Together!
- Power Platform Integrations (Read-only)
- Power Platform and Dynamics 365 Integrations (Read-only)
- Training and Consulting
- Instructor Led Training
- Dashboard in a Day for Women, by Women
- Galleries
- Community Connections & How-To Videos
- COVID-19 Data Stories Gallery
- Themes Gallery
- Data Stories Gallery
- R Script Showcase
- Webinars and Video Gallery
- Quick Measures Gallery
- 2021 MSBizAppsSummit Gallery
- 2020 MSBizAppsSummit Gallery
- 2019 MSBizAppsSummit Gallery
- Events
- Ideas
- Custom Visuals Ideas
- Issues
- Issues
- Events
- Upcoming Events
- Community Blog
- Power BI Community Blog
- Custom Visuals Community Blog
- Community Support
- Community Accounts & Registration
- Using the Community
- Community Feedback
Register now to learn Fabric in free live sessions led by the best Microsoft experts. From Apr 16 to May 9, in English and Spanish.
- Power BI forums
- Galleries
- Quick Measures Gallery
- Combine Sales and Forecast


- Mark as New
- Bookmark
- Subscribe
- Mute
- Subscribe to RSS Feed
- Permalink
- Report Inappropriate Content
Combine Sales and Forecast
Intro:
There are many ways to analyze Actual Sales and Forecasts. One commonly used metric is the Year-End forecast, which combines Actual Sales with Forecasts for future dates.
This example uses monthly values for both Sales and Forecast. Daily data will work with these measures also.
Date Cutoff:
A future date is any date which does not have Sales information available. There are two ways to mark the cutoff date:
1. Create a new column in the date table, which indicates whether or not each date is before or after the cutoff date. In this case, I use an M script for the date dimension. Since the Sales data is at the month level, it finds the most recent month with Sales and then checks whether the month is before or after that month:
maxSales = List.Max(Table.Column(Sales, "yearmonth")),
InsertHasSalesData = Table.AddColumn(#"Changed Type", "Has Sales Data",
each if [Month Key] <= maxSales then "Yes"
else "No")
2. Create a new Measure. In this case, we already have the dates marked, so we can use that information:
Max Sales Date =
CALCULATE(
    MAX('Date'[Date]),
    FILTER(
        ALL('Date'),
        'Date'[Has Sales Data] = "Yes"
    )
)
Alternatively, the Sales date could be referenced. (Again, this example uses monthly data - this will not work here):
Max Sales Date =
CALCULATE(
    MAX('Sales'[Sales Date]),
    ALL('Date')
)
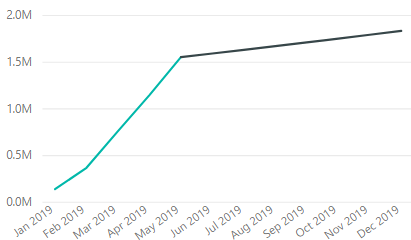
Connecting Actuals and Forecast in Line Charts:
Using the cutoff date, the Forecast can be limited to only consider later dates. However, to make a continuous line chart, the measure also needs to match the Actuals on the max Actuals date. Monthly and YTD measures can be accomplished as follows:
Amount Forecast Future Only With Final Sales =
var curdate = MAX('Date'[Date])
return SWITCH(
    TRUE(),
    curdate < [Max Sales Date], BLANK(),
    curdate = [Max Sales Date], [Amount Sales],
    [Amount Forecast Future Only]
)
Amount Forecast Future Only YTD With Final Sales =
var curdate = MAX('Date'[Date])
return SWITCH(
    TRUE(),
    curdate < [Max Sales Date], BLANK(),
    [Amount Sales YTD] + [Amount Forecast YTD Future Only]
)
Cheers!
Nathan
eyJrIjoiZDJmNTQwZDctODI3ZS00ODg5LWFiYzctODk4NzYzYzIxMTcyIiwidCI6IjM1MDY5ZDc0LTE0ODktNDE5NC04MGM3LTNhODEzODVlYWQ1YiIsImMiOjh9