- Power BI forums
- Updates
- News & Announcements
- Get Help with Power BI
- Desktop
- Service
- Report Server
- Power Query
- Mobile Apps
- Developer
- DAX Commands and Tips
- Custom Visuals Development Discussion
- Health and Life Sciences
- Power BI Spanish forums
- Translated Spanish Desktop
- Power Platform Integration - Better Together!
- Power Platform Integrations (Read-only)
- Power Platform and Dynamics 365 Integrations (Read-only)
- Training and Consulting
- Instructor Led Training
- Dashboard in a Day for Women, by Women
- Galleries
- Community Connections & How-To Videos
- COVID-19 Data Stories Gallery
- Themes Gallery
- Data Stories Gallery
- R Script Showcase
- Webinars and Video Gallery
- Quick Measures Gallery
- 2021 MSBizAppsSummit Gallery
- 2020 MSBizAppsSummit Gallery
- 2019 MSBizAppsSummit Gallery
- Events
- Ideas
- Custom Visuals Ideas
- Issues
- Issues
- Events
- Upcoming Events
- Community Blog
- Power BI Community Blog
- Custom Visuals Community Blog
- Community Support
- Community Accounts & Registration
- Using the Community
- Community Feedback
Register now to learn Fabric in free live sessions led by the best Microsoft experts. From Apr 16 to May 9, in English and Spanish.
- Power BI forums
- Forums
- Get Help with Power BI
- Power Query
- Re: Sorting and Comparing Columns Question
- Subscribe to RSS Feed
- Mark Topic as New
- Mark Topic as Read
- Float this Topic for Current User
- Bookmark
- Subscribe
- Printer Friendly Page
- Mark as New
- Bookmark
- Subscribe
- Mute
- Subscribe to RSS Feed
- Permalink
- Report Inappropriate Content
Sorting and Comparing Columns Question
Good Day!
I had two questions, please. The first, I know has to have been answered. I get close in searching but the answers don't appear to work or don't answer the question specifically.
1) I have a SQL table that has a month and year column. I concantenate them in Power BI to have a year/month column. I am trying to sort so that it shows "2021/1" then "2021/2" rather than sorting as a string and putting "2021/10". I've tried creating an index column where value is 2*year + month and then sorting by that. I sorts properly in the data view, but then when I go the the visual (as pictured) it doesn't update.
2) How would I got about comparing the current month's invoice to the previous month and then either:
- highlighting the month if it's more than, say, 10% plus or minus 10 precent from the previous month or
- perhaps there's a column in between the dates that is checked if it is off by 10 percent?
In other words - some how signifying if the current month deviates from the previous month by 10% up or down?
If this can only be done by the last months - and not historically - that is an option - but would be nice to show a history....
Any help would be much appreciated!
THANK YOU!
Rob
Solved! Go to Solution.
- Mark as New
- Bookmark
- Subscribe
- Mute
- Subscribe to RSS Feed
- Permalink
- Report Inappropriate Content
Hi @Anonymous ,
Here a walkthrough on the first part of your question.
We have two tables, TableA is our FactTable and looks like this:
TableB is our Date dimension including a Date and the respective Index
The tables are connected via the Date column.
When using a matrix, without utilizing the DateIndex, we get the following result:
Obviously, PBI orders the strings alphabetically. As you suggested, we need an index column which PBI can use to sort it accordingly.
This is how you do it:
Go to the Data tab, select the column you'd like to sort (Date), click on Sort by column (Column tools ribbon) and choose the index column (DateIndex)
And the result should be like this:
Note, the Index Column needs to be in number format!
Let me know if his helps! 🙂
/Tom
https://www.tackytech.blog/
https://www.instagram.com/tackytechtom/
| Did I answer your question❓➡️ Please, mark my post as a solution ✔️ |
| Also happily accepting Kudos 🙂 |
| Feel free to connect with me on LinkedIn! | |
| #proudtobeasuperuser |  |
- Mark as New
- Bookmark
- Subscribe
- Mute
- Subscribe to RSS Feed
- Permalink
- Report Inappropriate Content
SO, I was able to figure out the sorting combining the index value I created (tweaking it to 3*year + month) - but here is what I didn't know, that I got from your answer - that you could sort a column based upon another column. When I did that, I got it to work. NOW, I just need to understand the min/max and % difference solution you had. 😉
- Mark as New
- Bookmark
- Subscribe
- Mute
- Subscribe to RSS Feed
- Permalink
- Report Inappropriate Content
No worries, everyone is here to help. You can create a date table in Power Query or in DAX in the table itself. I will show you that later in this screenshot.
1) go to the table icon in the left navigation;
2) click on new table;
3) paste in your simple date table code. There's lot of examples to use, this is one from SQLBI.com. Remember in my code example, I am pointing to Table1[Period] which would represent the concatenated column you created - yours will likely be named something else;
4) Mark as date table;
5) Select the column that is the date column (will be Date);
6) Click OK. When successful you will see the 'Validated sucessfully' notification.
Always glad to help - Tom

- Mark as New
- Bookmark
- Subscribe
- Mute
- Subscribe to RSS Feed
- Permalink
- Report Inappropriate Content
Hi @Anonymous ,
For the highlighting, I'd suggest to create a measure that calculates the difference. Then, you can use that measure to do the color coding. Let's start with the initial situation from my previous example:
We have two tables, TableA is our FactTable and looks like this:
TableB is our Date dimension including a Date and the respective Index
The tables are connected via the Date column.
The first measure (that you already have) is in my case this one:
ValueMeasure = SUM ( TableA[Value] )
Second, we need another measure that calculates the difference (%) between each month. I just created this one quickly, but pressumably you need to calculate it differently. The point of my reply is not showing how to calculate such a differences but more how you can use such a measure for color coding:
ValuesMeasureDiff% =
VAR _valueCurrentMonth = CALCULATE ( [ValueMeasure], TableB[DateIndex] = MAX ( TableB[DateIndex] ) )
VAR _valuePreviousMonth = CALCULATE ( [ValueMeasure], ALLEXCEPT(TableA, TableA[Type] ), TableB[DateIndex] = MAX ( TableB[DateIndex] ) - 1 )
RETURN
DIVIDE (_valueCurrentMonth - _valuePreviousMonth, _valuePreviousMonth ) + 0
Here the result using both of the measure underneath:
Now you can select the table visual and in the Visualisations tab on the right hand side, click on the downwards arrow on the Values field. Choose conditional formatting and then background color:
Fill in the settings accordingly. Make sure to use your Diff% measure:
And here the result:
There is even the possibility to create a color coding measure in DAX, which is pretty cool, too! It's less of a hassle if you wanna reuse the same settings on mutliple visuals.
Here you can find more information:
Conditional table formatting in Power BI Desktop - Power BI | Microsoft Docs
Let me know if this helps 🙂
/Tom
https://www.tackytech.blog/
https://www.instagram.com/tackytechtom/
| Did I answer your question❓➡️ Please, mark my post as a solution ✔️ |
| Also happily accepting Kudos 🙂 |
| Feel free to connect with me on LinkedIn! | |
| #proudtobeasuperuser |  |
- Mark as New
- Bookmark
- Subscribe
- Mute
- Subscribe to RSS Feed
- Permalink
- Report Inappropriate Content
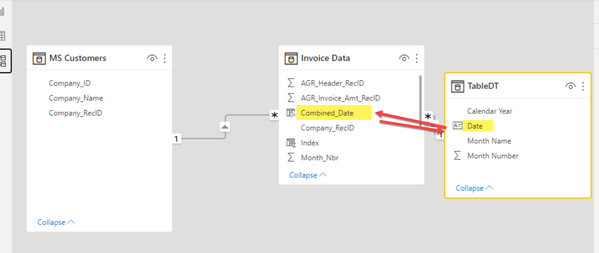
@tom480 , I pray I haven't worn out my questions yet. I was finally able to get the dates to work. The problem was is that it wasn't recognizing the "DAX" created date, I had to go into PQ and create a date that way. My problem now is in understanding some of the formulas you put down. Also, at the bottom, just to be sure, I have a screen shot of the relationship I built. I got a little confused because you referenced (in one of the messages above, it gets confusing following the trail) something about a "period" I just created a reference between the two dates. Is that ok?
So I believe I only have this I'm confused on:
1) The first measure, ValueMeasure, (I haven not created Measures yet). Does it matter which table I "right-click" and create measure with?
2) I assume that in ValueMeasure = SUM ( TableA[Value] ), that "TableA" is my Invoice Data table, but not sure what [Value A] is?
3) Can you help walk me through the logic of in _valueCurrentMonth and Previous Month? and do I create them in the same manner as above in #1?
VAR _valueCurrentMonth = CALCULATE ( [ValueMeasure], TableB[DateIndex] = MAX ( TableB[DateIndex] ) )
VAR _valuePreviousMonth = CALCULATE ( [ValueMeasure], ALLEXCEPT(TableA, TableA[Type] ), TableB[DateIndex] = MAX ( TableB[DateIndex] ) - 1 )
My apologies if these are stupid questions.
- Mark as New
- Bookmark
- Subscribe
- Mute
- Subscribe to RSS Feed
- Permalink
- Report Inappropriate Content
Hi @Anonymous ,
To get the columns to sort correctly, make sure your column is marked as a date type. Next you can format the field to show the desired yyyy-mm.
I populated a few rows of data just to show the column sorting functionality, not a great dataset but suffices.
Next you want to create a basic date table so you can use the time intelligence features in Power BI and DAX. Here's some sample code to use:
 When marked as a date column, your sorting will work correctly (not concatenated text).
 In power query, column type Date (could be in DAX too though)
 Change to desired format...
 Create a quick data table to use time intelligence in Power BI / DAX
 Use the quick measures to get the most common measures
- Mark as New
- Bookmark
- Subscribe
- Mute
- Subscribe to RSS Feed
- Permalink
- Report Inappropriate Content
Forgot to include step: Mark as date table...
- Mark as New
- Bookmark
- Subscribe
- Mute
- Subscribe to RSS Feed
- Permalink
- Report Inappropriate Content
WOW - @tom480
First, thank you. Thank you very much. This is a lot to consume at once and, I hate to embarrass myself, I am very new to PBI and so some of this is difficult to grasp right now. The main way of pulling in data at this point has been just pulling in data from MS SQL tables so all that is going on in your TableDT creation is first time seeing and just trying to figure out where even to start with what I have - which is just two tables, one that lists my customers (companies) and then one that just pulls in the invoice amount and the month and year.
So my first thing I'll say (question) is - when you mention about making sure that a particular field is a date, the invoice table, believe it or not, does not have a date column...just a month and a year column. So when I created my "combined_date" column I just concantenated those into 2022/1, for example. Thus not sure that I could even convert that to a date field - but I'm probably skipping by a few steps here. Just trying to figure out where to start. Here's some screen shots on the data I have.
I think if I can grasp what you're teaching me here, it will go a long way to me furthering my understanding of PBI. I cannot thank you enough for your time.
- Mark as New
- Bookmark
- Subscribe
- Mute
- Subscribe to RSS Feed
- Permalink
- Report Inappropriate Content
No problem. Glad to help, I enjoy solving puzzles. You can also take your concatenated column and then simply mark it as a date type (in power query or DAX). I like this path because you still need to create a date table to get the time intelligence measures you want in your second question. And don't worry about being new to Power BI - it's a huge field and asking for help is part of the process - even if you have been using for a long time.
- Mark as New
- Bookmark
- Subscribe
- Mute
- Subscribe to RSS Feed
- Permalink
- Report Inappropriate Content
I'm having a difficult time following the trail now, apologies. So, to tackle the highlighting issue. To break it down, I assume step 1 would be that I still need to format my date as a date type? (Even though it's a string of YYYY/MM (With no day?). Or do I need to create a date (remember, the SQL table just has month and year) by putting a '1" as the day - get it in the right format and then convert THAT do a date format?
Step 2 would be creating the date reference table via your code I re-pasted below? If so, Do I do that by Get Data->Blank Query and then putting in your code? (If so, could you help walk me through the code (is [Period] the date column?, what is FILTER and CALENDARAUTO() doing? And all the trailing code after that "CY" , FORMAT..etc) Sigh. Sorry....
Also - can you
- Mark as New
- Bookmark
- Subscribe
- Mute
- Subscribe to RSS Feed
- Permalink
- Report Inappropriate Content
No worries, glad to help.
On question #1: I did a test and you can use your concatenated column as is, just mark it as a date type. From there you can change to the desired format (either in DAX or PQ). I added a screenshot of the formula below.

On question #2: SQLBI.com has a great article on creating a simple date table and probably does a better job explaining than me. In my opinion, you will need to do this to create the time intelligence measures you are looking for and for the most part, you can use the quick measures and skip learning a ton of advanced time intelligence DAX measures from scratch - quick measures are a great place to start. From there, conditional formatting can be applied and you can include the other measures you are looking for too.
Creating a simple date table in DAX - SQLBI
Always glad to help - tom@gotoreports.com
- Mark as New
- Bookmark
- Subscribe
- Mute
- Subscribe to RSS Feed
- Permalink
- Report Inappropriate Content
Ok - silly question - where steps do I take, within PBI, to create the Date Table? (ie where do I plop that formula down)? (embarrassed)
And an even more embarrassing question - when you say edit "via DAX or PQ" - how do I know exactly which is which here...I KNOW that sounds silly. So, for example, I wanted to go into "Transform Data" to then "add a column" and do the concantenate there originally, but it wasn't recognizing "Concantenate" there. I had to, from my main PBI screen on the data tab - right click the table and add column that way - THEN I could use it in a formula there.
I ask because I had just gone into the Power Query Editor to transform the data to make that column (contancentanted) a date/time form - but the column wasn't there....
- Mark as New
- Bookmark
- Subscribe
- Mute
- Subscribe to RSS Feed
- Permalink
- Report Inappropriate Content
No worries, everyone is here to help. You can create a date table in Power Query or in DAX in the table itself. I will show you that later in this screenshot.
1) go to the table icon in the left navigation;
2) click on new table;
3) paste in your simple date table code. There's lot of examples to use, this is one from SQLBI.com. Remember in my code example, I am pointing to Table1[Period] which would represent the concatenated column you created - yours will likely be named something else;
4) Mark as date table;
5) Select the column that is the date column (will be Date);
6) Click OK. When successful you will see the 'Validated sucessfully' notification.
Always glad to help - Tom

- Mark as New
- Bookmark
- Subscribe
- Mute
- Subscribe to RSS Feed
- Permalink
- Report Inappropriate Content
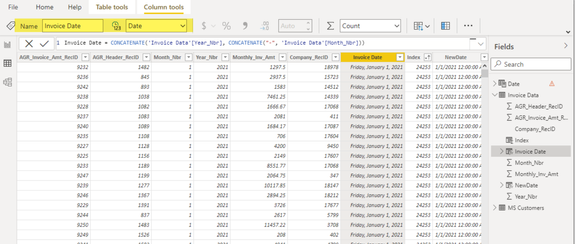
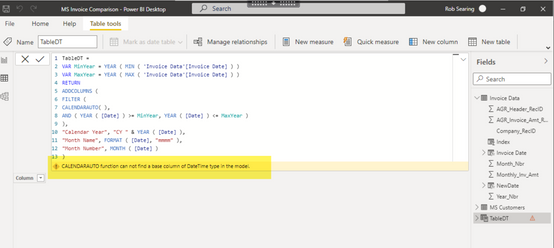
So, something is not working (see second screen shot).
For my dataset, the first screen shot is what I'm pulling in. All are columns from a SQL statement to the database. I create the date via the DAX formula I'm pointing too, then I converted that to a date/time...which changed the format of the column.....but that's my "date" that I'm trying to use for my date table.
I KNOW i've said this a million times, and I know you've been very patient - I just have to say again, thank you for your direction and help!
- Mark as New
- Bookmark
- Subscribe
- Mute
- Subscribe to RSS Feed
- Permalink
- Report Inappropriate Content
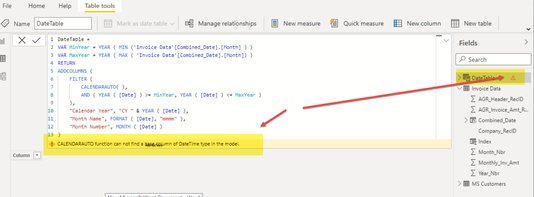
Just to add - there *IS* a date in my table (screen shot below). I started trying to follow the video you linked and when I jus type
"Date = CALENDARAUTO()" it SHOULD return dates - but it's saying it cannot find a Date/Time in the model - yet...as screen shot below shows - I do have a date.
Pulling what little hair I have out...lol
- Mark as New
- Bookmark
- Subscribe
- Mute
- Subscribe to RSS Feed
- Permalink
- Report Inappropriate Content
Hi @Anonymous ,
I think the issue is Date/Time. Make the column type a Date type.
Then use this to create your Date Table:
We will figure it out! Tom
- Mark as New
- Bookmark
- Subscribe
- Mute
- Subscribe to RSS Feed
- Permalink
- Report Inappropriate Content
@tom480 - when this is all said and done - you NEED to somehow let me Paypal you something - even small - to thank you for your time.
(NOTE: I did upload a copy of the table as an Excel file to my Google Drive here. I only removed the customer table. Not sure if this helps)
So, I believe I had tried that. Here's where I'm changing it back to Date
And still getting error:
- Mark as New
- Bookmark
- Subscribe
- Mute
- Subscribe to RSS Feed
- Permalink
- Report Inappropriate Content
No worries! And you don't owe me anything, glad to help. I took the google sheet and downloaded a copy and imported into PBI, , changed the format of the invoice date column to the desired, then created my date table and marked as date table. I have included a copy of my pbix for review. I think this will help! Tom 😀


- Mark as New
- Bookmark
- Subscribe
- Mute
- Subscribe to RSS Feed
- Permalink
- Report Inappropriate Content
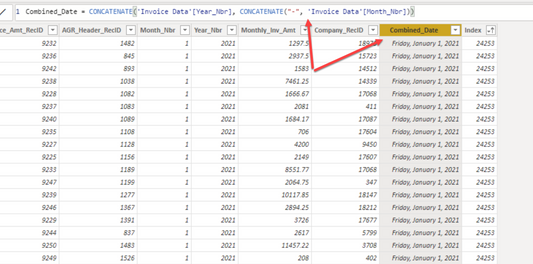
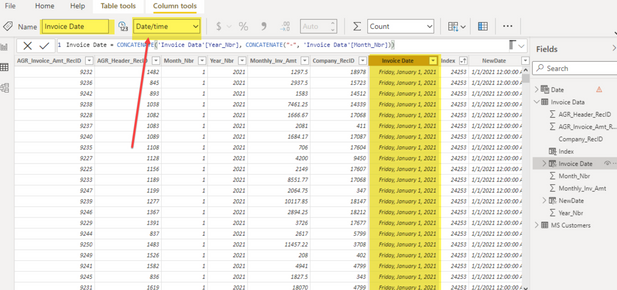
Getting back to this and ready to scream. I was able to open up your report (after updating my PBI Desktop version) and it pulls in ok. However, I'm still unable to modify my version. I need to stick with this as it has the SQL connection to pull in new invoices. I'm not sure why I'm getting "CALENDARAUTO function can not find a base column of DateTime type in the model"...other than I'm not truly pulling in a "date" from the database, I'm pulling in a Month and Year and then converting it to a date in the Combined_Date column as a Date type (see first screen shot). Then, I create a new column ("New Date") which is just equal to the Combined_Date column but as a "Date/Time" type (second screen shot). I don't know if I need to create a new forum question just on this alone? It's making me feel entirely stupid. I'd send you the file, but not sure how to remove the SQL connection that has, obviously, the connection details - while leaving the data in tact.
- Mark as New
- Bookmark
- Subscribe
- Mute
- Subscribe to RSS Feed
- Permalink
- Report Inappropriate Content
Also - could I not (on the sorting) create a DateIndex column inside the first table as just a column? It appears it's just the month #, which I already have. Also, how would this work with two years, 2021 and 2022?
- Mark as New
- Bookmark
- Subscribe
- Mute
- Subscribe to RSS Feed
- Permalink
- Report Inappropriate Content
Hi @Anonymous ,
Here a walkthrough on the first part of your question.
We have two tables, TableA is our FactTable and looks like this:
TableB is our Date dimension including a Date and the respective Index
The tables are connected via the Date column.
When using a matrix, without utilizing the DateIndex, we get the following result:
Obviously, PBI orders the strings alphabetically. As you suggested, we need an index column which PBI can use to sort it accordingly.
This is how you do it:
Go to the Data tab, select the column you'd like to sort (Date), click on Sort by column (Column tools ribbon) and choose the index column (DateIndex)
And the result should be like this:
Note, the Index Column needs to be in number format!
Let me know if his helps! 🙂
/Tom
https://www.tackytech.blog/
https://www.instagram.com/tackytechtom/
| Did I answer your question❓➡️ Please, mark my post as a solution ✔️ |
| Also happily accepting Kudos 🙂 |
| Feel free to connect with me on LinkedIn! | |
| #proudtobeasuperuser |  |
- Mark as New
- Bookmark
- Subscribe
- Mute
- Subscribe to RSS Feed
- Permalink
- Report Inappropriate Content
SO, I was able to figure out the sorting combining the index value I created (tweaking it to 3*year + month) - but here is what I didn't know, that I got from your answer - that you could sort a column based upon another column. When I did that, I got it to work. NOW, I just need to understand the min/max and % difference solution you had. 😉
- Mark as New
- Bookmark
- Subscribe
- Mute
- Subscribe to RSS Feed
- Permalink
- Report Inappropriate Content
awesome @Anonymous !
don't forget to mark the replies as solutions so others have it easy to find it 🙂
just give a ping if you need more help!
/Tom
https://www.tackytech.blog/
https://www.instagram.com/tackytechtom/
| Did I answer your question❓➡️ Please, mark my post as a solution ✔️ |
| Also happily accepting Kudos 🙂 |
| Feel free to connect with me on LinkedIn! | |
| #proudtobeasuperuser |  |
Helpful resources

Microsoft Fabric Learn Together
Covering the world! 9:00-10:30 AM Sydney, 4:00-5:30 PM CET (Paris/Berlin), 7:00-8:30 PM Mexico City

Power BI Monthly Update - April 2024
Check out the April 2024 Power BI update to learn about new features.


