- Power BI forums
- Updates
- News & Announcements
- Get Help with Power BI
- Desktop
- Service
- Report Server
- Power Query
- Mobile Apps
- Developer
- DAX Commands and Tips
- Custom Visuals Development Discussion
- Health and Life Sciences
- Power BI Spanish forums
- Translated Spanish Desktop
- Power Platform Integration - Better Together!
- Power Platform Integrations (Read-only)
- Power Platform and Dynamics 365 Integrations (Read-only)
- Training and Consulting
- Instructor Led Training
- Dashboard in a Day for Women, by Women
- Galleries
- Community Connections & How-To Videos
- COVID-19 Data Stories Gallery
- Themes Gallery
- Data Stories Gallery
- R Script Showcase
- Webinars and Video Gallery
- Quick Measures Gallery
- 2021 MSBizAppsSummit Gallery
- 2020 MSBizAppsSummit Gallery
- 2019 MSBizAppsSummit Gallery
- Events
- Ideas
- Custom Visuals Ideas
- Issues
- Issues
- Events
- Upcoming Events
- Community Blog
- Power BI Community Blog
- Custom Visuals Community Blog
- Community Support
- Community Accounts & Registration
- Using the Community
- Community Feedback
Register now to learn Fabric in free live sessions led by the best Microsoft experts. From Apr 16 to May 9, in English and Spanish.
- Power BI forums
- Forums
- Get Help with Power BI
- Power Query
- Como criar tabela Power BI (CONT.SES) / How to cre...
- Subscribe to RSS Feed
- Mark Topic as New
- Mark Topic as Read
- Float this Topic for Current User
- Bookmark
- Subscribe
- Printer Friendly Page
- Mark as New
- Bookmark
- Subscribe
- Mute
- Subscribe to RSS Feed
- Permalink
- Report Inappropriate Content
Como criar tabela Power BI (CONT.SES) / How to create a Power BI table (COUNT.IFS)
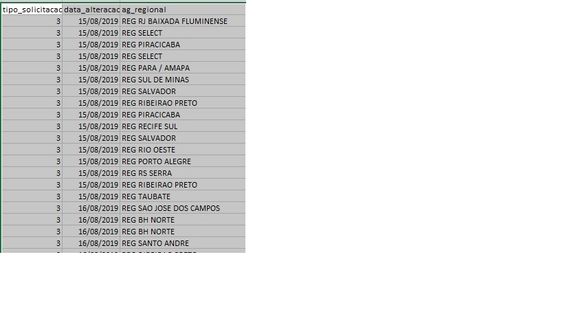
Tenho a seguite dúvida, tenho este schema de dados:
I have a question, I have this data schema:
Gostaria de realizar uma tabela assim no Power B.I (contagem de quantas consultas foram realizadas dado 1 dia por ag_regional)
I would like to do a table like this in Power B.I (count how many queries were done by ag_regional in one day)
Porém,tenho algumas considerações a modificar na tabela:
- Excluir os valores repetidos das colunas: ag_regional e data_alteração
- Criar uma tabela dessa automatizada sempre que eu carregar uma nova base de dados a contagem estar atualizada.
However, I've got some considerations to modify the table:
- Exclude repeated values from columns: ag_regional and data_alteracao
- Create such an automated table whenever I load a new database the count is up to date.
Solved! Go to Solution.
- Mark as New
- Bookmark
- Subscribe
- Mute
- Subscribe to RSS Feed
- Permalink
- Report Inappropriate Content
Hi lucas_dantasc,
You could refer to below sample, you could connect to your source, then copy the part below "source step" in your sample to see whether it work or not
let
    Source = Table.FromRows(Json.Document(Binary.Decompress(Binary.FromText("i45WMjIwtNQ31DdU0lFKBGJjpVgdFMEkbILJ2ATRtBuBBcuwCSZhE0zBJpiKKmgMFizHJohmuwluQTTbTbH5yBSbk0yRzYwFAA==", BinaryEncoding.Base64), Compression.Deflate)), let _t = ((type text) meta [Serialized.Text = true]) in type table [data_alteracao = _t, ag_regional = _t, tipo_solicitacao = _t]),
    #"Changed Type" = Table.TransformColumnTypes(Source,{{"data_alteracao", type date}, {"ag_regional", type text}}),
    #"Grouped Rows" = Table.Group(#"Changed Type", {"tipo_solicitacao", "data_alteracao", "ag_regional"}, {{"Count", each Table.RowCount(_), type number}}),
    #"Pivoted Column" = Table.Pivot(Table.TransformColumnTypes(#"Grouped Rows", {{"data_alteracao", type text}}, "en-US"), List.Distinct(Table.TransformColumnTypes(#"Grouped Rows", {{"data_alteracao", type text}}, "en-US")[data_alteracao]), "data_alteracao", "Count", List.Sum)
in
    #"Pivoted Column"
Best Regards,
Zoe Zhi
If this post helps, then please consider Accept it as the solution to help the other members find it more quickly.
- Mark as New
- Bookmark
- Subscribe
- Mute
- Subscribe to RSS Feed
- Permalink
- Report Inappropriate Content
Hi lucas_dantasc,
I am not clear about your requirement, did you want to get result like second image in PowerBI? If so, you could try below M code in PowerBI.
let
    Source = Table.FromRows(Json.Document(Binary.Decompress(Binary.FromText("i45WMjIwtNQ31DdU0lFKVIrVQRFIQhdIRhdA0mIEFihDF0hCF0hBF0hFCBiDBcrRBZBsMcEugGSLKbpLTdGtNYWZEQsA", BinaryEncoding.Base64), Compression.Deflate)), let _t = ((type text) meta [Serialized.Text = true]) in type table [date = _t, name = _t]),
    #"Changed Type" = Table.TransformColumnTypes(Source,{{"date", type date}, {"name", type text}}),
    #"Grouped Rows" = Table.Group(#"Changed Type", {"date", "name"}, {{"Count", each Table.RowCount(_), type number}}),
    #"Pivoted Column" = Table.Pivot(Table.TransformColumnTypes(#"Grouped Rows", {{"date", type text}}, "en-US"), List.Distinct(Table.TransformColumnTypes(#"Grouped Rows", {{"date", type text}}, "en-US")[date]), "date", "Count", List.Sum)
in
    #"Pivoted Column"
Best Regards,
Zoe Zhi
If this post helps, then please consider Accept it as the solution to help the other members find it more quickly.
- Mark as New
- Bookmark
- Subscribe
- Mute
- Subscribe to RSS Feed
- Permalink
- Report Inappropriate Content
Zoe, that's perfect! but how do I put my variables (data_alteracao in date and name in ag_regional) in your script?
Could you help me please?
Thanks!!
- Mark as New
- Bookmark
- Subscribe
- Mute
- Subscribe to RSS Feed
- Permalink
- Report Inappropriate Content
Hi lucas_dantasc,
You could refer to below sample, you could connect to your source, then copy the part below "source step" in your sample to see whether it work or not
let
    Source = Table.FromRows(Json.Document(Binary.Decompress(Binary.FromText("i45WMjIwtNQ31DdU0lFKBGJjpVgdFMEkbILJ2ATRtBuBBcuwCSZhE0zBJpiKKmgMFizHJohmuwluQTTbTbH5yBSbk0yRzYwFAA==", BinaryEncoding.Base64), Compression.Deflate)), let _t = ((type text) meta [Serialized.Text = true]) in type table [data_alteracao = _t, ag_regional = _t, tipo_solicitacao = _t]),
    #"Changed Type" = Table.TransformColumnTypes(Source,{{"data_alteracao", type date}, {"ag_regional", type text}}),
    #"Grouped Rows" = Table.Group(#"Changed Type", {"tipo_solicitacao", "data_alteracao", "ag_regional"}, {{"Count", each Table.RowCount(_), type number}}),
    #"Pivoted Column" = Table.Pivot(Table.TransformColumnTypes(#"Grouped Rows", {{"data_alteracao", type text}}, "en-US"), List.Distinct(Table.TransformColumnTypes(#"Grouped Rows", {{"data_alteracao", type text}}, "en-US")[data_alteracao]), "data_alteracao", "Count", List.Sum)
in
    #"Pivoted Column"
Best Regards,
Zoe Zhi
If this post helps, then please consider Accept it as the solution to help the other members find it more quickly.
Helpful resources

Microsoft Fabric Learn Together
Covering the world! 9:00-10:30 AM Sydney, 4:00-5:30 PM CET (Paris/Berlin), 7:00-8:30 PM Mexico City

Power BI Monthly Update - April 2024
Check out the April 2024 Power BI update to learn about new features.


