First I'll try my best to explain the issue, I made a simplified version of the report I have problem with.
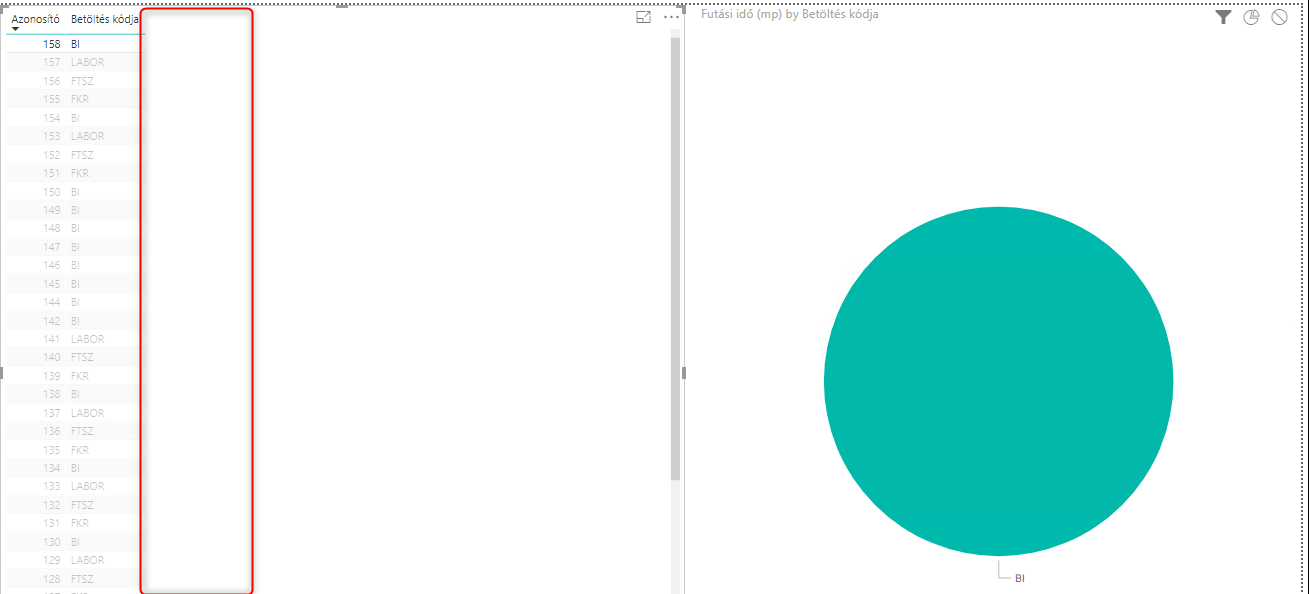
I have 2 visuals on my riport, a table and a pie chart, both using the same and only table.
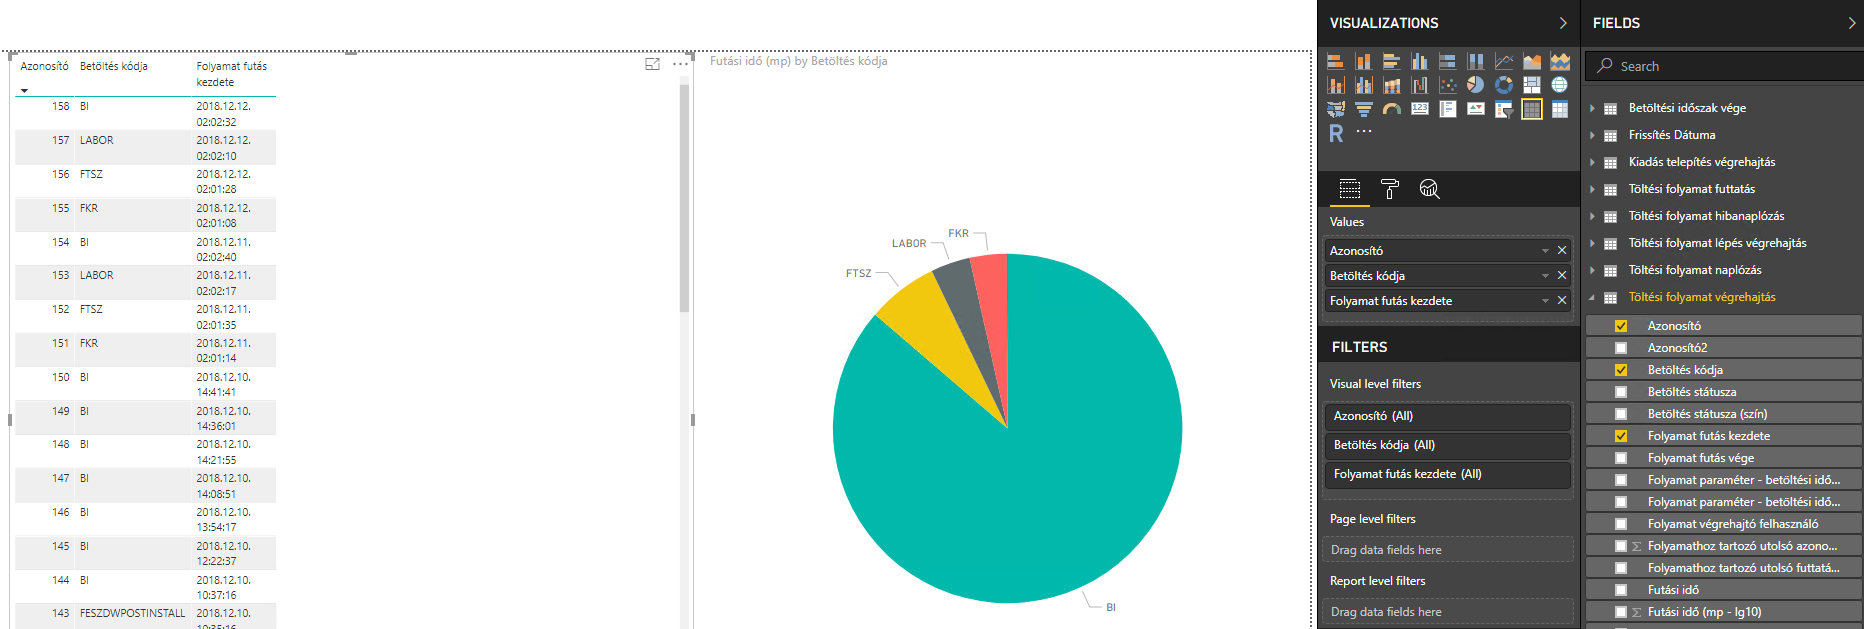
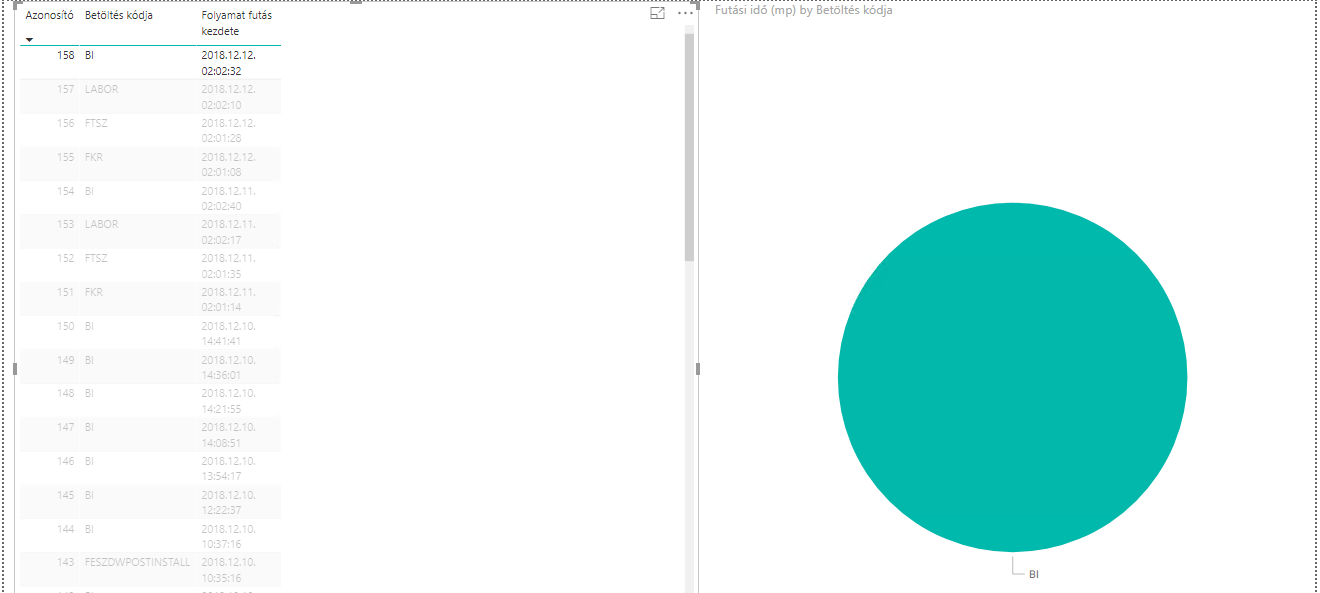
Currently there are no filters on the page. If I select the first row of the table, on the pie chart I see the corresponding data to that row, just as expected, so far so good.
But if I filter out one of the codes (but not the BI), the pie chart shows nothing:
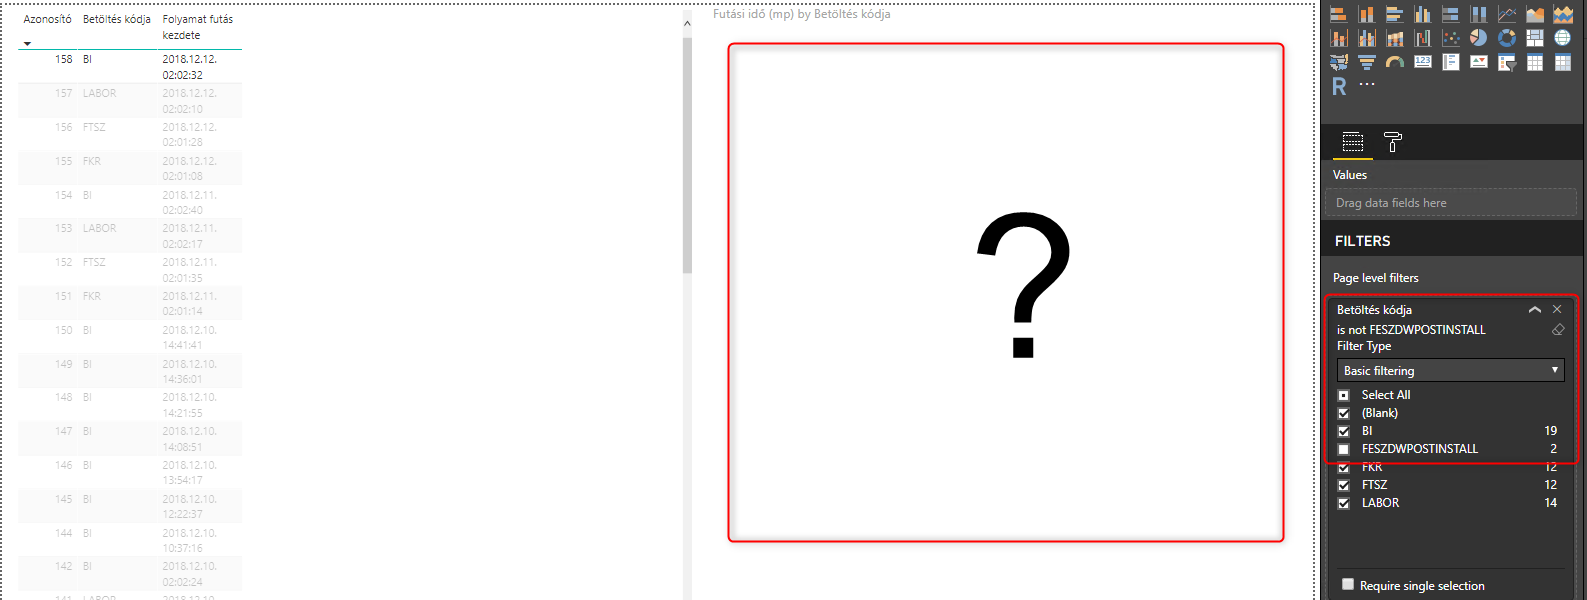
This already doesn't make sense to me, I'm filtering out records with the "FESZDWPOSTINSTALL" code and selecting the "BI" from the table. But let's not stop here. Currently the "interaction" from the table to the pie chart is set to "filter", not "highlight". If I change it back, it works:
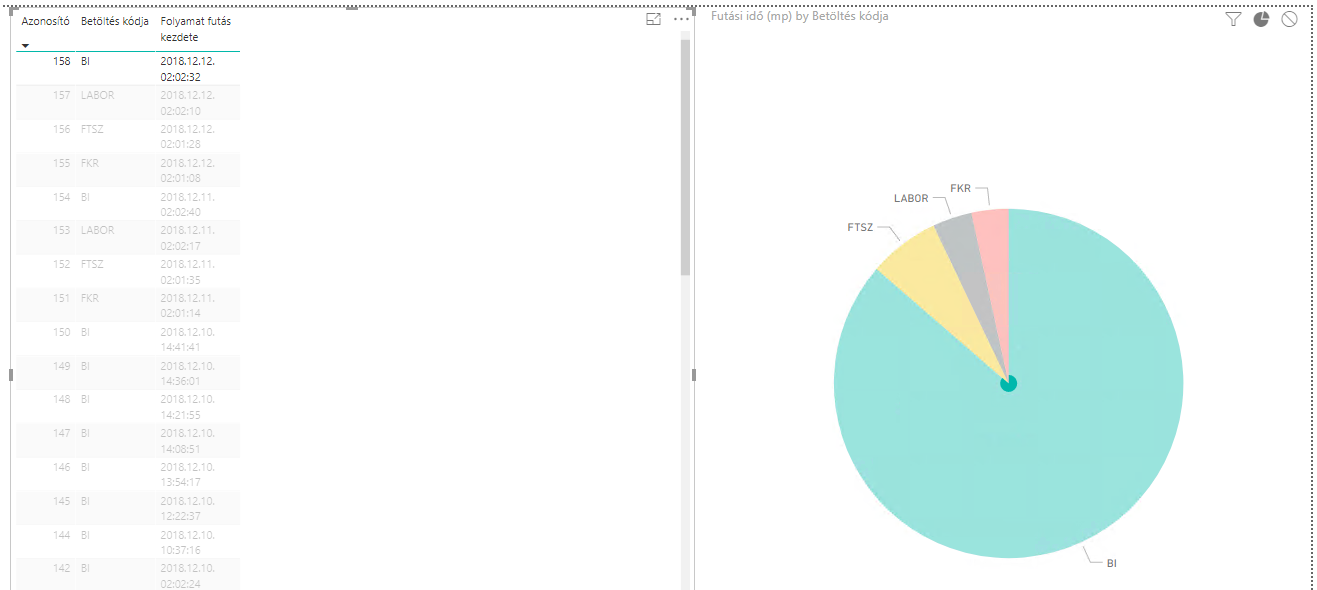
Even better: if I remove the last column from the table, change the interaction to "filter", it still works:
I have no idea what's going on :(. Can you help me out? Unfortunately I'm using SSAS as a source so I can't really provide the source data for the report.
Thanks for the answer/help in advance.
 v-xiaoyan-msft
on:
Cannot share PowerBi reorts and dashboards to my o...
v-xiaoyan-msft
on:
Cannot share PowerBi reorts and dashboards to my o...
 on:
Get External Data: Power BI semantic models throws...
on:
Get External Data: Power BI semantic models throws...
 Idrissshatila
on:
Timeline slicer is showing 30 & 31 March under 30 ...
Idrissshatila
on:
Timeline slicer is showing 30 & 31 March under 30 ...