- Power BI forums
- Updates
- News & Announcements
- Get Help with Power BI
- Desktop
- Service
- Report Server
- Power Query
- Mobile Apps
- Developer
- DAX Commands and Tips
- Custom Visuals Development Discussion
- Health and Life Sciences
- Power BI Spanish forums
- Translated Spanish Desktop
- Power Platform Integration - Better Together!
- Power Platform Integrations (Read-only)
- Power Platform and Dynamics 365 Integrations (Read-only)
- Training and Consulting
- Instructor Led Training
- Dashboard in a Day for Women, by Women
- Galleries
- Community Connections & How-To Videos
- COVID-19 Data Stories Gallery
- Themes Gallery
- Data Stories Gallery
- R Script Showcase
- Webinars and Video Gallery
- Quick Measures Gallery
- 2021 MSBizAppsSummit Gallery
- 2020 MSBizAppsSummit Gallery
- 2019 MSBizAppsSummit Gallery
- Events
- Ideas
- Custom Visuals Ideas
- Issues
- Issues
- Events
- Upcoming Events
- Community Blog
- Power BI Community Blog
- Custom Visuals Community Blog
- Community Support
- Community Accounts & Registration
- Using the Community
- Community Feedback
Register now to learn Fabric in free live sessions led by the best Microsoft experts. From Apr 16 to May 9, in English and Spanish.
- Power BI forums
- Forums
- Get Help with Power BI
- Developer
- Re: how to improve cumulative performance
- Subscribe to RSS Feed
- Mark Topic as New
- Mark Topic as Read
- Float this Topic for Current User
- Bookmark
- Subscribe
- Printer Friendly Page
- Mark as New
- Bookmark
- Subscribe
- Mute
- Subscribe to RSS Feed
- Permalink
- Report Inappropriate Content
how to improve cumulative performance
hi everyone,
i have performance issue with cumulative, my idea is to move the logic from powerBI to sql, is it effective ? or any other suggestion ?
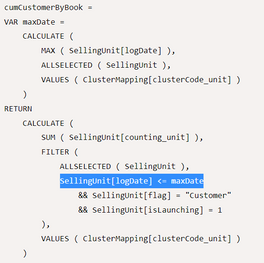
below my dax script which have performance issue
thanks
Solved! Go to Solution.
- Mark as New
- Bookmark
- Subscribe
- Mute
- Subscribe to RSS Feed
- Permalink
- Report Inappropriate Content
finally i found the solution
oke, the issue is "slow performance while using cumulative"
root couse -> my chart using "dimdate" instead of "logdate"
solution -> for cumulative dont using relational table, use column that u call in measure
i change from dimDate to logdate and viola from 1 minutes to 15seconds
- Mark as New
- Bookmark
- Subscribe
- Mute
- Subscribe to RSS Feed
- Permalink
- Report Inappropriate Content
i have an update sir,
one factor why the performance is not good is because im include year on date hierarchy
without year it takes 4 second, and with year it takes 1 minutes
- Mark as New
- Bookmark
- Subscribe
- Mute
- Subscribe to RSS Feed
- Permalink
- Report Inappropriate Content
hi @v-shex-msft , thanks for your fast response
9765 -> total row data
i want to compare cumulative value group by flag (customer & sales)
thats why i create 2 measure ( cumulative by customer, cumulative by sales )
which my previous excample is cumulative by customer ->
SellingUnit[flag] = "Customer"
and also i want to filter by date and cluster ( it can be multiple filter ) -> thats by im using "in values"
SellingUnit[clusterCode_unit]
in VALUES(ClusterMapping[clusterCode_unit])
and function by default of cumulative im using maxdate
SellingUnit[logDate]<= maxDate
while im using your script the result is different
warm regards,
Nofan irkham
- Mark as New
- Bookmark
- Subscribe
- Mute
- Subscribe to RSS Feed
- Permalink
- Report Inappropriate Content
Hi @nofan_munawar,
How many records stored in data table that you calculated? Can you please share some mode detail about your scenario?
How to Get Your Question Answered Quickly
It obviously will cause the performance issue when you use cumulative expression to calculate through huge amount of table records. You can also try to use the following formula if helps:
cumCustomerByBook =
VAR maxDate =
    CALCULATE (
        MAX ( SellingUnit[logDate] ),
        ALLSELECTED ( SellingUnit ),
        VALUES ( ClusterMapping[clusterCode_unit] )
    )
RETURN
    CALCULATE (
        SUM ( SellingUnit[counting_unit] ),
        FILTER (
            ALLSELECTED ( SellingUnit ),
            SellingUnit[logDate] <= maxDate
                && SellingUnit[flag] = "Customer"
                && SellingUnit[isLaunching] = 1
        ),
        VALUES ( ClusterMapping[clusterCode_unit] )
    )
Regards,
Xiaoxin Sheng
If this post helps, please consider accept as solution to help other members find it more quickly.
- Mark as New
- Bookmark
- Subscribe
- Mute
- Subscribe to RSS Feed
- Permalink
- Report Inappropriate Content
finally i found the solution
oke, the issue is "slow performance while using cumulative"
root couse -> my chart using "dimdate" instead of "logdate"
solution -> for cumulative dont using relational table, use column that u call in measure
i change from dimDate to logdate and viola from 1 minutes to 15seconds
Helpful resources

Microsoft Fabric Learn Together
Covering the world! 9:00-10:30 AM Sydney, 4:00-5:30 PM CET (Paris/Berlin), 7:00-8:30 PM Mexico City

Power BI Monthly Update - April 2024
Check out the April 2024 Power BI update to learn about new features.

| User | Count |
|---|---|
| 13 | |
| 2 | |
| 2 | |
| 1 | |
| 1 |
| User | Count |
|---|---|
| 20 | |
| 3 | |
| 2 | |
| 2 | |
| 2 |


