cancel
Showing results for 
Search instead for 
Did you mean: 

Register now to learn Fabric in free live sessions led by the best Microsoft experts. From Apr 16 to May 9, in English and Spanish.

Reply
JordB
Regular Visitor

SQL Query Editor Advise

Hi,

I'm struggling to figure out the best way to tackle this problem.

I have an SQL db with PBI gateway, Premium Service.

I have a table like below:


ID         |Overidden ID |Owning Location |DelLocation |Start Date    |EndDate       |Poperty1  |Property2 | etc
1          |0            |Loc1            |Cus1        |2018-07-01    |2018-08-01    |True      |12        |
2          |1            |Loc1            |Cus1        |2018-07-10    |2018-07-10    |True      |10        |


I want to display 7 days data using a slicer. So if I used a slicer and selected Wc 1st July. Then I would only display the details for ID 1. But if I filtered on Wc 8th July then I need to display the detail of ID1 for everyday other than the 10th. There can also be overidden overides, say the original could last 3 months, then an overide for a week in the middle then another overide for one day within the middle week.

I have zero control over the SQL db.


3 REPLIES 3
v-jiascu-msft
Employee
Employee

Hi @JordB,


Does Wc mean "Work Calendar"?

"display the detail of ID1 for every day" means repeating ID 1 for 7 times, doesn't it?

Can you post the expected result, please?


Best Regards,

Dale


Community Support Team _ Dale
If this post helps, then please consider Accept it as the solution to help the other members find it more quickly.

2018-08-06_12-08-06.jpg


I was thinking of a Matrix basically like the pic above.

The Week commencing would be a slicer from a date table I have.

The days would need to be measures I think as the top row would need to know that it was overidden on the Tuesday in this case.

Hi @JordB,


There could be a solution. What do the other records look like? Please refer to the demo in the attachment.

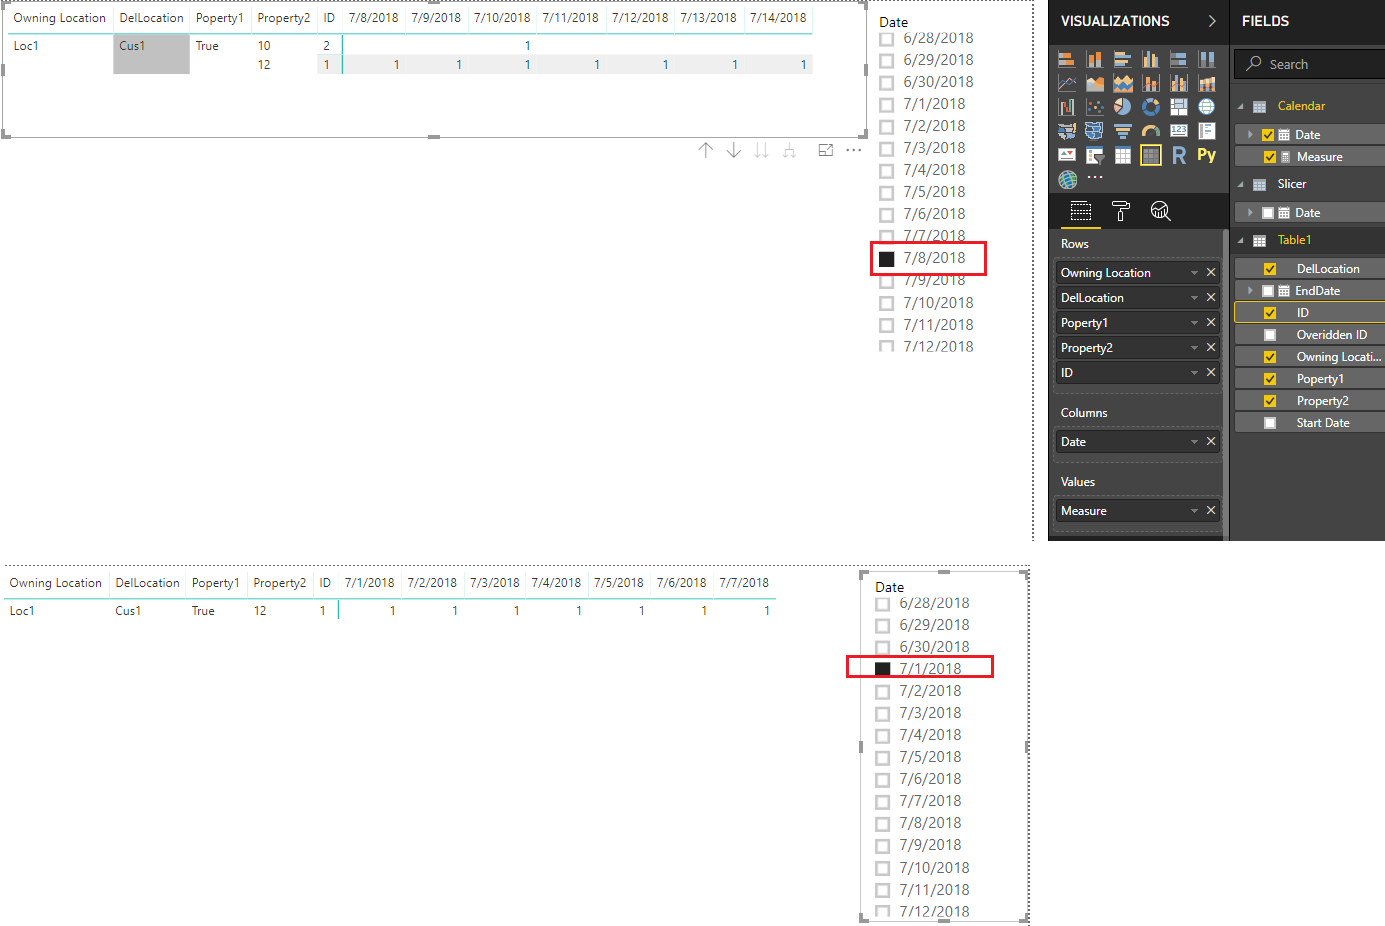
1. Create two date tables. One for creating a relationship. 

2. Create a measure.

Measure =
VAR selectedDate =
    IF (
        SELECTEDVALUE ( Slicer[Date] ),
        SELECTEDVALUE ( Slicer[Date] ),
        CALCULATE ( MIN ( 'Calendar'[Date] ), ALL ( 'Calendar' ) )
    )
VAR startDate =
    CALCULATE ( MIN ( Table1[Start Date] ), ALL ( 'Calendar'[Date] ) )
VAR endDate =
    CALCULATE ( MIN ( Table1[EndDate] ), ALL ( 'Calendar'[Date] ) )
RETURN
    IF (
        MIN ( 'Calendar'[Date] ) >= selectedDate
            && MIN ( 'Calendar'[Date] )
                <= selectedDate + 6,
        IF (
            MIN ( 'Calendar'[Date] ) >= startDate
                && MIN ( 'Calendar'[Date] ) <= endDate,
            1,
            BLANK ()
        ),
        BLANK ()
    )

SQL_Query_Editor_Advise


Best Regards,

Dale

Community Support Team _ Dale
If this post helps, then please consider Accept it as the solution to help the other members find it more quickly.

Helpful resources

Announcements
Microsoft Fabric Learn Together

Microsoft Fabric Learn Together

Covering the world! 9:00-10:30 AM Sydney, 4:00-5:30 PM CET (Paris/Berlin), 7:00-8:30 PM Mexico City

PBI_APRIL_CAROUSEL1

Power BI Monthly Update - April 2024

Check out the April 2024 Power BI update to learn about new features.

April Fabric Community Update

Fabric Community Update - April 2024

Find out what's new and trending in the Fabric Community.

Top Kudoed Authors