- Power BI forums
- Updates
- News & Announcements
- Get Help with Power BI
- Desktop
- Service
- Report Server
- Power Query
- Mobile Apps
- Developer
- DAX Commands and Tips
- Custom Visuals Development Discussion
- Health and Life Sciences
- Power BI Spanish forums
- Translated Spanish Desktop
- Power Platform Integration - Better Together!
- Power Platform Integrations (Read-only)
- Power Platform and Dynamics 365 Integrations (Read-only)
- Training and Consulting
- Instructor Led Training
- Dashboard in a Day for Women, by Women
- Galleries
- Community Connections & How-To Videos
- COVID-19 Data Stories Gallery
- Themes Gallery
- Data Stories Gallery
- R Script Showcase
- Webinars and Video Gallery
- Quick Measures Gallery
- 2021 MSBizAppsSummit Gallery
- 2020 MSBizAppsSummit Gallery
- 2019 MSBizAppsSummit Gallery
- Events
- Ideas
- Custom Visuals Ideas
- Issues
- Issues
- Events
- Upcoming Events
- Community Blog
- Power BI Community Blog
- Custom Visuals Community Blog
- Community Support
- Community Accounts & Registration
- Using the Community
- Community Feedback
Register now to learn Fabric in free live sessions led by the best Microsoft experts. From Apr 16 to May 9, in English and Spanish.
- Power BI forums
- Forums
- Get Help with Power BI
- Developer
- Merging Legends for both geom Line and Point
- Subscribe to RSS Feed
- Mark Topic as New
- Mark Topic as Read
- Float this Topic for Current User
- Bookmark
- Subscribe
- Printer Friendly Page
- Mark as New
- Bookmark
- Subscribe
- Mute
- Subscribe to RSS Feed
- Permalink
- Report Inappropriate Content
Merging Legends for both geom Line and Point
I was very new to R Script. If you are able to help my problem that would be really great... Here is my problem...
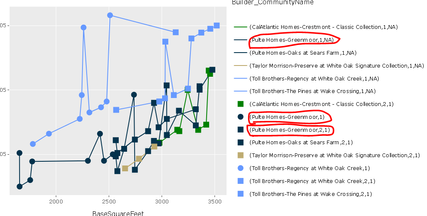
I am able to create custom visual using R Script and make hover over work in that visual by using this below link Link I think It is displaying legend for both line and point as well. This is how it is showing me in the graph
But I would like to show up something like this…. Which represents both the line and point in the same legend name.
Please find the R Script below, Please go through that and can you tell me where I was going wrong….
source('./r_files/flatten_HTML.r')

Library Declarations:

       library(htmlwidgets);library(XML);library(ggplot2);library(plotly);

      Values$Storiesgrouping <- as.character(Values$Storiesgrouping)
      Cols <- as.character(Values$Color)
      names(Cols) <- as.character(Values$Builder_CommunityName)
      Sizs <- as.numeric(Values$Size)
      names(Sizs) <- as.character(Values$Builder_CommunityName)

Actual code:

g <- ggplot(Values, aes(x=BaseSquareFeet, y=BasePriceM,
                        group=Builder_CommunityName, color=Builder_CommunityName))+
  geom_line()+
  geom_point(aes(shape=Storiesgrouping), show.legend=FALSE,size=3)+
  scale_colour_manual(values = Cols)+
  scale_size_manual(values = Sizs)+
  scale_shape_manual(values=c("1"=19, "2"=15, "3+"=17))
plot(g)
- Mark as New
- Bookmark
- Subscribe
- Mute
- Subscribe to RSS Feed
- Permalink
- Report Inappropriate Content
We recommend to send this issue to pbircvsupport@microsoft.com.
This email alias is supported by expirienced R-script developers.
Ignat Vilesov,
Software Engineer
Microsoft Power BI Custom Visuals
Helpful resources

Microsoft Fabric Learn Together
Covering the world! 9:00-10:30 AM Sydney, 4:00-5:30 PM CET (Paris/Berlin), 7:00-8:30 PM Mexico City

Power BI Monthly Update - April 2024
Check out the April 2024 Power BI update to learn about new features.

| User | Count |
|---|---|
| 12 | |
| 2 | |
| 2 | |
| 1 | |
| 1 |


