- Power BI forums
- Updates
- News & Announcements
- Get Help with Power BI
- Desktop
- Service
- Report Server
- Power Query
- Mobile Apps
- Developer
- DAX Commands and Tips
- Custom Visuals Development Discussion
- Health and Life Sciences
- Power BI Spanish forums
- Translated Spanish Desktop
- Power Platform Integration - Better Together!
- Power Platform Integrations (Read-only)
- Power Platform and Dynamics 365 Integrations (Read-only)
- Training and Consulting
- Instructor Led Training
- Dashboard in a Day for Women, by Women
- Galleries
- Community Connections & How-To Videos
- COVID-19 Data Stories Gallery
- Themes Gallery
- Data Stories Gallery
- R Script Showcase
- Webinars and Video Gallery
- Quick Measures Gallery
- 2021 MSBizAppsSummit Gallery
- 2020 MSBizAppsSummit Gallery
- 2019 MSBizAppsSummit Gallery
- Events
- Ideas
- Custom Visuals Ideas
- Issues
- Issues
- Events
- Upcoming Events
- Community Blog
- Power BI Community Blog
- Custom Visuals Community Blog
- Community Support
- Community Accounts & Registration
- Using the Community
- Community Feedback
Register now to learn Fabric in free live sessions led by the best Microsoft experts. From Apr 16 to May 9, in English and Spanish.
- Power BI forums
- Forums
- Get Help with Power BI
- Developer
- How to draw a linear line by using a given slope
- Subscribe to RSS Feed
- Mark Topic as New
- Mark Topic as Read
- Float this Topic for Current User
- Bookmark
- Subscribe
- Printer Friendly Page
- Mark as New
- Bookmark
- Subscribe
- Mute
- Subscribe to RSS Feed
- Permalink
- Report Inappropriate Content
How to draw a linear line by using a given slope
Hello there, i have an urgent problem here that i cant solve...
I'm trying to draw a linear line in a scatter plot to visualize a given slope-value.
First of all, this is how i calculate my "slope" by simply dividing each value from the x-axis with each value of the y-axis.
-> Btw: This will only change the color-values of the datapoints, not the actual datapoint-positions <-
function visualTransform(...) {

...

for (let i = 0; i < myCategory.values.length; i++) {

   if((xAxisValues[i]/yAxisValues[i]>0.2){

	   colorVal = 'blue';

   } else {

	   colorVal = 'yellow';

   }

}

...

}
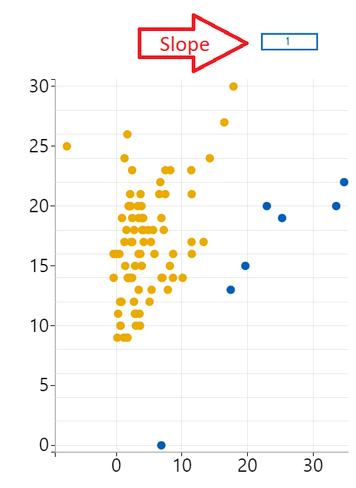
For example, this is how the scatter plot looks like with a slope of 0.2 in comparison with a slope of 1
Now im looking for a solution for how to draw a linear line by using a given slope.
I tried that of course by creating a svg element and just rotating it by converting the slope-value in to degrees, like in this function (-> a slope of 0.2 is about 11.3 degrees)
var angleRad = Math.atan(ay/ax);
var angleDeg = angleRad * 180 / Math.PI;
return(angleDeg);
// if the slope is 0.2, this will be about 78.69 deg. But we have to subtract it from 90 as the line is in a 90 deg position, which makes 11.3
}
...
// Drawing the linear line:
             let sLine = this.g
                .append('g')
                .append('rect')
                .classed('sLine', true)
                .attr('x', x(0))
                .attr('y', y(30))
                .attr('width', 2)
                .attr('height', gHeight)
                .attr('transform', 'rotate(' + (getAngleDeg(0.2,1)) + ',' + x(0) + ',' + y(30) + ')')
                .style('fill-opacity', viewModel.settings.generalView.opacity/100);
But unfortunately this only works partial for me.
As you can see in the picture, at a certain point it works fine:
But as i scale the visual smaller it looks totally wrong, because the datapoints begin to compress more and more. The line is not affected however:
I dont know how to fix this... My next idea was to subtract the degree-value by using a multiplier as the visual-sandbox size changes. Didnt worked either.
There must be an easier way!
Does anyone has a solution?
Solved! Go to Solution.
- Mark as New
- Bookmark
- Subscribe
- Mute
- Subscribe to RSS Feed
- Permalink
- Report Inappropriate Content
The width and height are not supported by a line element.
It seems you should apply a color to this line.
Ignat Vilesov,
Software Engineer
Microsoft Power BI Custom Visuals
- Mark as New
- Bookmark
- Subscribe
- Mute
- Subscribe to RSS Feed
- Permalink
- Report Inappropriate Content
Thanks this worked for me:
               let sLine = this.g
               .append('g')
               .append('line')
               .classed('sLine', true)
               .attr('x1', x(0))
               .attr('y1', y(0))
               .attr('x2', x(viewModel.dataMax * this.slopeVal[0]))
               .attr('y2', y(viewModel.dataMax))
               .attr('stroke', 'red');
Helpful resources

Microsoft Fabric Learn Together
Covering the world! 9:00-10:30 AM Sydney, 4:00-5:30 PM CET (Paris/Berlin), 7:00-8:30 PM Mexico City

Power BI Monthly Update - April 2024
Check out the April 2024 Power BI update to learn about new features.

| User | Count |
|---|---|
| 14 | |
| 2 | |
| 2 | |
| 1 | |
| 1 |


