- Power BI forums
- Updates
- News & Announcements
- Get Help with Power BI
- Desktop
- Service
- Report Server
- Power Query
- Mobile Apps
- Developer
- DAX Commands and Tips
- Custom Visuals Development Discussion
- Health and Life Sciences
- Power BI Spanish forums
- Translated Spanish Desktop
- Power Platform Integration - Better Together!
- Power Platform Integrations (Read-only)
- Power Platform and Dynamics 365 Integrations (Read-only)
- Training and Consulting
- Instructor Led Training
- Dashboard in a Day for Women, by Women
- Galleries
- Community Connections & How-To Videos
- COVID-19 Data Stories Gallery
- Themes Gallery
- Data Stories Gallery
- R Script Showcase
- Webinars and Video Gallery
- Quick Measures Gallery
- 2021 MSBizAppsSummit Gallery
- 2020 MSBizAppsSummit Gallery
- 2019 MSBizAppsSummit Gallery
- Events
- Ideas
- Custom Visuals Ideas
- Issues
- Issues
- Events
- Upcoming Events
- Community Blog
- Power BI Community Blog
- Custom Visuals Community Blog
- Community Support
- Community Accounts & Registration
- Using the Community
- Community Feedback
Register now to learn Fabric in free live sessions led by the best Microsoft experts. From Apr 16 to May 9, in English and Spanish.
- Power BI forums
- Forums
- Get Help with Power BI
- Developer
- Re: Custom visual text input (search)
- Subscribe to RSS Feed
- Mark Topic as New
- Mark Topic as Read
- Float this Topic for Current User
- Bookmark
- Subscribe
- Printer Friendly Page
- Mark as New
- Bookmark
- Subscribe
- Mute
- Subscribe to RSS Feed
- Permalink
- Report Inappropriate Content
Custom visual text input (search)
Hi,
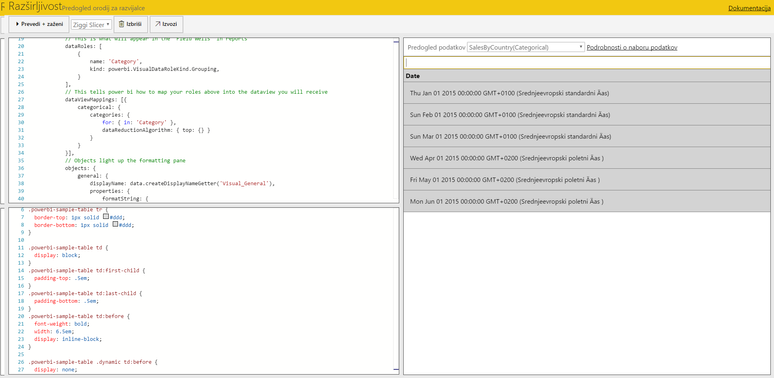
I have created a custom visual with a text input, which I wanted to use for a search through slicer. For the start I made just a search through table. It worked perfectly fine on development tools.
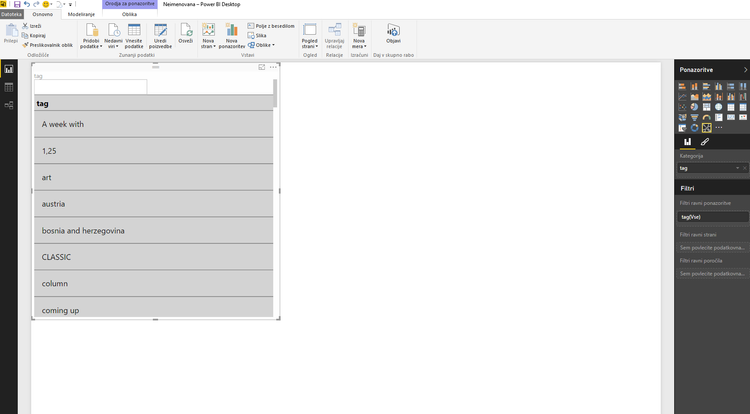
But when I import it into power bi desktop I can't use the input. It looks like it is disabled or keyboard events are not being processed.
Why is that?
Solved! Go to Solution.
- Mark as New
- Bookmark
- Subscribe
- Mute
- Subscribe to RSS Feed
- Permalink
- Report Inappropriate Content
If someone didn't see, Microsoft already made custom visual with search capability. It is called Attribute Slicer. You can find it here:
https://app.powerbi.com/visuals/show/AttributeSlicer1652434005853
- Mark as New
- Bookmark
- Subscribe
- Mute
- Subscribe to RSS Feed
- Permalink
- Report Inappropriate Content
This is a great concept - I'd really like to help get it working. Can you share your code so far? Github?
Have you tried publishing that PBI Desktop file to the PBI web service and testing it there?
- Mark as New
- Bookmark
- Subscribe
- Mute
- Subscribe to RSS Feed
- Permalink
- Report Inappropriate Content
Hi, thanks for your replay. I tried web service as well but it is the same.
I will share my code here:
module powerbi.visuals {
    export interface CategoryViewModel {
        value: string;
        identity: string;
        color: string;
    }

    export interface ValueViewModel {
        values: any[];
    }

    export interface ViewModel {
        header: any;
        values: ValueViewModel[];
    }

    export class MySlicer implements IVisual {
        public static capabilities: VisualCapabilities = {
            // This is what will appear in the 'Field Wells' in reports
            dataRoles: [
                {
                    name: 'Category',
                    kind: powerbi.VisualDataRoleKind.Grouping,
                }
            ],
            // This tells power bi how to map your roles above into the dataview you will receive
            dataViewMappings: [{
                categorical: {
                    categories: {
                        for: { in: 'Category' },
                        dataReductionAlgorithm: { top: {} }
                    }
                }
            }],
            // Objects light up the formatting pane
            objects: {
                general: {
                    displayName: data.createDisplayNameGetter('Visual_General'),
                    properties: {
                        formatString: {
                            type: { formatting: { formatString: true } },
                        },
                    },
                },
            }
        };

        public static converter(dataView: DataView, colors: IDataColorPalette): ViewModel {
            var viewModel: ViewModel = {
                header: 'Default Header',
                values: []
            }
            if (dataView) {
                var data = dataView.categorical.categories;
                var metadata = dataView.metadata;

                viewModel.header = metadata.columns[0].displayName;
                if (data && data.length > 0) {
                    for (var i = 0, catLength = data[0].values.length; i < catLength; i++) {
                        viewModel.values.push(data[0].values[i]);
                    }
                }
            }

            return viewModel;
        }

        private hostContainer: JQuery;
        private table: D3.Selection;
        private tHead: D3.Selection;
        private tBody: D3.Selection;
        private colorPalette: IDataColorPalette;
        private searchInput: D3.Selection;
        private searchString: string;

        /** This is called once when the visual is initialially created */
        public init(options: VisualInitOptions): void {
            this.colorPalette = options.style.colorPalette.dataColors;
            // element is the element in which your visual will be hosted.
            this.hostContainer = options.element.css('overflow-x', 'hidden');
            this.searchInput = d3.select(options.element.get(0))
                .append("input")
                .classed("my-input", true)
                .attr("type", "text");
            this.table = d3.select(options.element.get(0))
                .append("table")
                .classed('powerbi-sample-table', true);

            this.tHead = this.table.append('thead').append('tr').append('th');
            this.tBody = this.table.append('tbody');

            var slicerVisual = this;
            this.searchInput.on("keyup", function () {
                var searchString = slicerVisual.searchString =  $(this).val().toLowerCase();
                slicerVisual.onSearchInput(slicerVisual, searchString);
            });
        }

        public onSearchInput(slicerVisual, searchString) {
            var tds = slicerVisual.hostContainer.find("tbody tr");
            tds.each(function() {
                var rowString = $(this).text().toLowerCase();
                if(!searchString || rowString.indexOf(searchString) > -1)
                    $(this).removeClass("hidden");
                else
                    $(this).addClass("hidden");
            })
        }

        /** Update is called for data updates, resizes & formatting changes */
        public update(options: VisualUpdateOptions) {
            var dataViews = options.dataViews;
            if (!dataViews) return;

            this.updateContainerViewports(options.viewport);

            var viewModel = MySlicer.converter(dataViews[0], this.colorPalette);
            var slicerTitle = this.tHead.text(viewModel.header);
            var slicerData = this.tBody;
            this.tBody.html("");
            for(var row in viewModel.values) {
                var rowString = viewModel.values[row] + "";
                rowString = rowString.toLowerCase();
                if(!this.searchString || rowString.indexOf(this.searchString) > -1)
                    slicerData.append('tr').append('td').text(viewModel.values[row]);
                else
                    slicerData.append('tr').classed("hidden", true).append('td').text(viewModel.values[row]);
            }
        }

        private updateContainerViewports(viewport: IViewport) {
            var width = viewport.width;
            var height = viewport.height;

            this.tHead.classed('dynamic', width > 400);
            this.tBody.classed('dynamic', width > 400);

            this.hostContainer.css({
                'height': height,
                'width': width
            });
            this.table.attr('width', width);
        }

        private format(d: number){
            var prefix = d3.formatPrefix(d);
            return d3.round(prefix.scale(d),2) + ' ' +prefix.symbol
        }
    }
}
- Mark as New
- Bookmark
- Subscribe
- Mute
- Subscribe to RSS Feed
- Permalink
- Report Inappropriate Content
Hello,
I am looking for some help and Request you to please help me withan issue. I ran into a problem using Search Text Slicer. I have column Values as Co01, C0101, Co0102. Co0101, Co0102 are branches of the Co01. When I give input in the Search Bar with "Co01", total sale also includes Co0101 and Co0102. This is acts pretty much as a LIKE operator (Co01%). How Can i use the same visual or the same code to only take Co01 and not to include Co0101/Co0102.
TO be simple, search data to the exact search phrase and not to act as LIKE operator functionality
- Mark as New
- Bookmark
- Subscribe
- Mute
- Subscribe to RSS Feed
- Permalink
- Report Inappropriate Content
@trinathreddy Are you talking about Text Filter custom visual?
Ignat Vilesov,
Software Engineer
Microsoft Power BI Custom Visuals
- Mark as New
- Bookmark
- Subscribe
- Mute
- Subscribe to RSS Feed
- Permalink
- Report Inappropriate Content
Hi V-Viig,
Thanks for the Help. Yes, this is about Text Filter. The typed input basically works as % wildcard functionality. request you to please the develoepr know that, there are some instances people search for exact phrase.
Smart filer by OKVIZ (https://okviz.com/smart-filter/) works exactly the same as I want. But Search Text filter works much faster than Smart Filter. This fucntionality would be a great relief to look at quick insights about how a particular account annual sales.
To be Clear below is the Problem:
Current Funcationality: It takes what ever the input is and tries to match column values
Expected: If ABC and AB are the values, We need sales for only AB. It should not include ABC too. Please let me know if any questions.
- Mark as New
- Bookmark
- Subscribe
- Mute
- Subscribe to RSS Feed
- Permalink
- Report Inappropriate Content
Thank you for the clarification.
This feature request will be reported to developer to consider in upcoming versions.
Ignat Vilesov,
Software Engineer
Microsoft Power BI Custom Visuals
- Mark as New
- Bookmark
- Subscribe
- Mute
- Subscribe to RSS Feed
- Permalink
- Report Inappropriate Content
Hello,
Any progress on this topic?
Thanks,
Frank
- Mark as New
- Bookmark
- Subscribe
- Mute
- Subscribe to RSS Feed
- Permalink
- Report Inappropriate Content
Could you please clarify API version that you use?
Ignat Vilesov,
Software Engineer
Microsoft Power BI Custom Visuals
- Mark as New
- Bookmark
- Subscribe
- Mute
- Subscribe to RSS Feed
- Permalink
- Report Inappropriate Content
If someone didn't see, Microsoft already made custom visual with search capability. It is called Attribute Slicer. You can find it here:
https://app.powerbi.com/visuals/show/AttributeSlicer1652434005853
Helpful resources

Microsoft Fabric Learn Together
Covering the world! 9:00-10:30 AM Sydney, 4:00-5:30 PM CET (Paris/Berlin), 7:00-8:30 PM Mexico City

Power BI Monthly Update - April 2024
Check out the April 2024 Power BI update to learn about new features.

| User | Count |
|---|---|
| 14 | |
| 2 | |
| 2 | |
| 1 | |
| 1 |
| User | Count |
|---|---|
| 21 | |
| 2 | |
| 2 | |
| 2 | |
| 2 |


