Register now to learn Fabric in free live sessions led by the best Microsoft experts. From Apr 16 to May 9, in English and Spanish.
Hi all,
I've come across an issue with a dates table function and relating it to my data table. I've created the dates table using an M function that i got from a udemy course video. I've linked it with a table of data i want to analyse. I want to create a line chart with year and the x axis and count of products from each manufacturer on the y axis. For some reason the year isn't sorting in chronological order. It seems like the year sorts fine when i put it as the legend but not on the x axis. I've checked the table relationships and they look fine, I've checked the data type of the columns i'm joining and they're both date type. I checked to see if i had duplicates in either table and i don't. I'm stumped as to why it's not working. I've included some screen shots of what I've done.
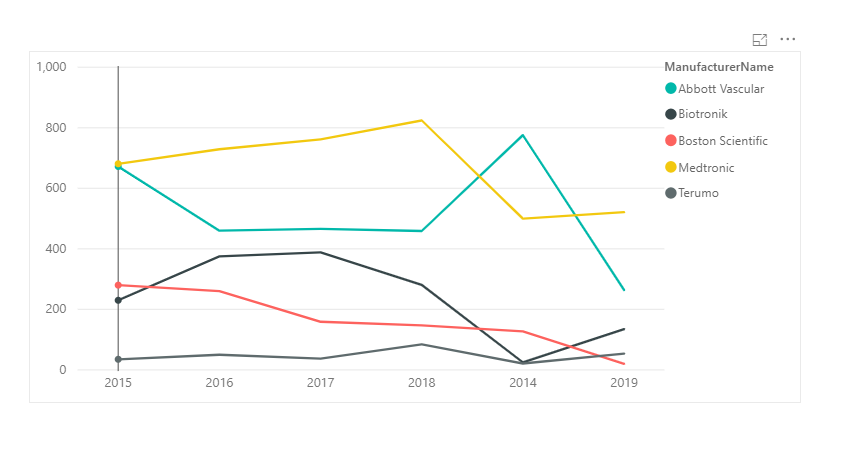
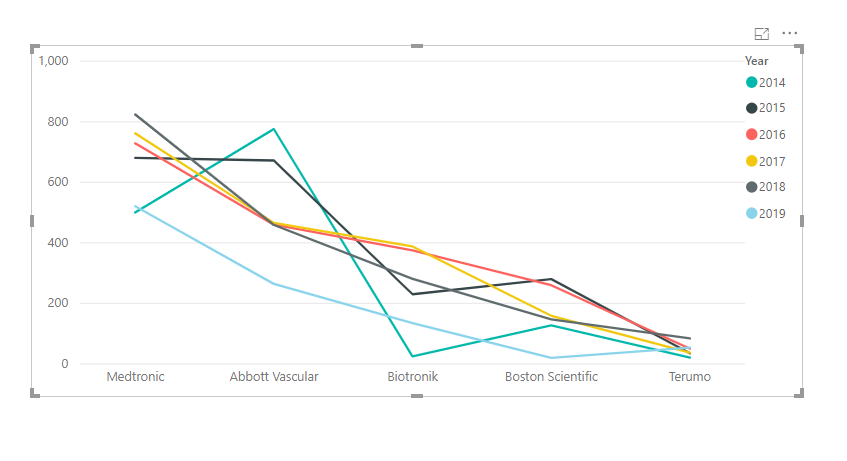
This is the chart with 2014 in the wrong position
Here the year looks like it's sorting fine
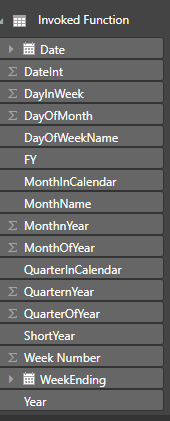
This the relationship between the tables
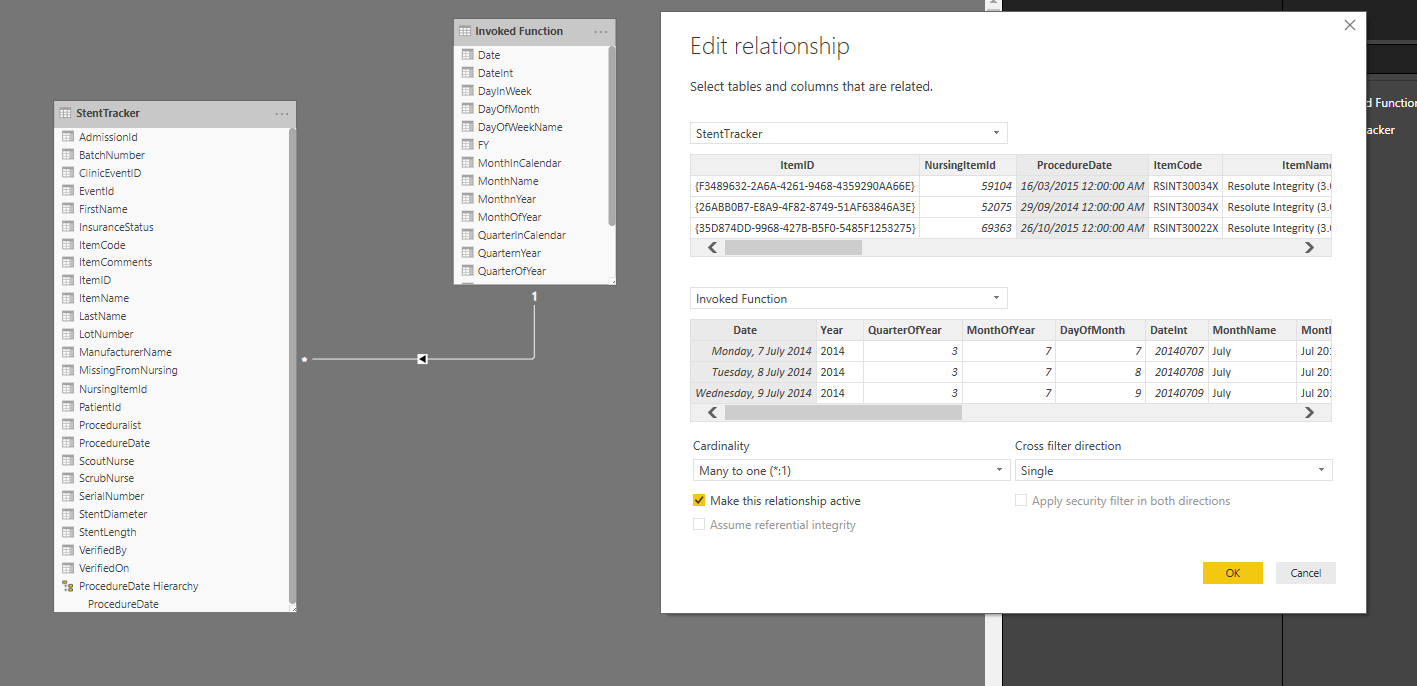
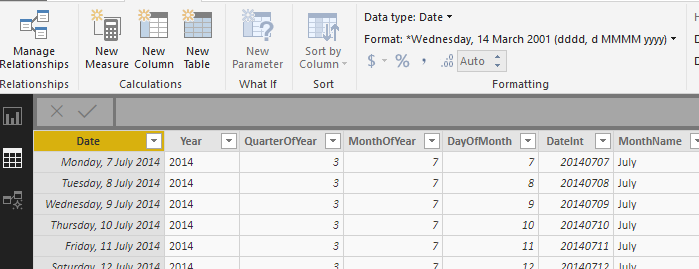
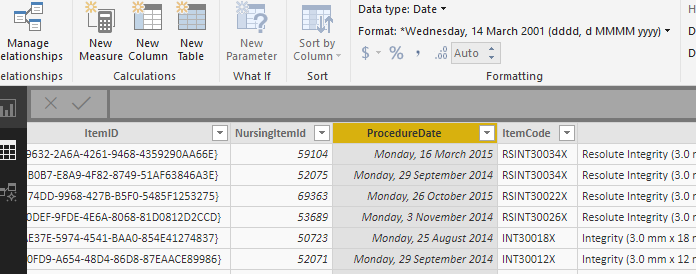
The data type of the columns that are joined are the same
Solved! Go to Solution.
Thanks everyone for your suggestions, I checked the x-axis and it was categorical and not continuous. It wouldn't let me change it to continuous and so i had a look at the data type of the year variable and it was set as text and not numeric. I've changed it and it's working fine now. Thanks for your help!
With the chart selected, go to the format pane. Under the X axis, is the type set to Categorical instead of Continuous?
Thanks everyone for your suggestions, I checked the x-axis and it was categorical and not continuous. It wouldn't let me change it to continuous and so i had a look at the data type of the year variable and it was set as text and not numeric. I've changed it and it's working fine now. Thanks for your help!
Weird indeed, the line chart is sorted on year decending/acending?
Weird. My best guess is there are spaces before and or after some of the columns, changing the sort order.
Covering the world! 9:00-10:30 AM Sydney, 4:00-5:30 PM CET (Paris/Berlin), 7:00-8:30 PM Mexico City
Check out the April 2024 Power BI update to learn about new features.
User | Count |
---|---|
114 | |
98 | |
86 | |
70 | |
62 |
User | Count |
---|---|
151 | |
120 | |
103 | |
87 | |
68 |