- Power BI forums
- Updates
- News & Announcements
- Get Help with Power BI
- Desktop
- Service
- Report Server
- Power Query
- Mobile Apps
- Developer
- DAX Commands and Tips
- Custom Visuals Development Discussion
- Health and Life Sciences
- Power BI Spanish forums
- Translated Spanish Desktop
- Power Platform Integration - Better Together!
- Power Platform Integrations (Read-only)
- Power Platform and Dynamics 365 Integrations (Read-only)
- Training and Consulting
- Instructor Led Training
- Dashboard in a Day for Women, by Women
- Galleries
- Community Connections & How-To Videos
- COVID-19 Data Stories Gallery
- Themes Gallery
- Data Stories Gallery
- R Script Showcase
- Webinars and Video Gallery
- Quick Measures Gallery
- 2021 MSBizAppsSummit Gallery
- 2020 MSBizAppsSummit Gallery
- 2019 MSBizAppsSummit Gallery
- Events
- Ideas
- Custom Visuals Ideas
- Issues
- Issues
- Events
- Upcoming Events
- Community Blog
- Power BI Community Blog
- Custom Visuals Community Blog
- Community Support
- Community Accounts & Registration
- Using the Community
- Community Feedback
Register now to learn Fabric in free live sessions led by the best Microsoft experts. From Apr 16 to May 9, in English and Spanish.
- Power BI forums
- Forums
- Get Help with Power BI
- Desktop
- Re: wrong rank in negative values
- Subscribe to RSS Feed
- Mark Topic as New
- Mark Topic as Read
- Float this Topic for Current User
- Bookmark
- Subscribe
- Printer Friendly Page
- Mark as New
- Bookmark
- Subscribe
- Mute
- Subscribe to RSS Feed
- Permalink
- Report Inappropriate Content
wrong rank in negative values
wrong rank in negative values
when i select sector and area hierarchy rank for negative values (category bikes) goes wrong
after branch 6 branch 2 should have rank 2
also rank should start from 4
see attached pbix
https://drive.google.com/open?id=0Bw-_YmJ3Q49gTnpKTnQzNktTZ1k
Solved! Go to Solution.
- Mark as New
- Bookmark
- Subscribe
- Mute
- Subscribe to RSS Feed
- Permalink
- Report Inappropriate Content
@giorgiokatr what about :
First create a measure to sum [Total USD], like :
Sum_USD = SUM(temp[Total USD])
Then rank all table and use the last measure as expression:
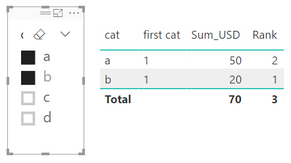
Rank = RANKX(ALLSELECTED(temp),[Sum_USD],,ASC,Dense)
No filters applied
Filter
cat = {a,b}
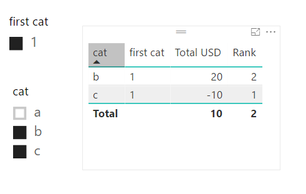
filter
firstCat={1} and
cat={b,c}
In this way you will rank the values according to what is selected.
- Mark as New
- Bookmark
- Subscribe
- Mute
- Subscribe to RSS Feed
- Permalink
- Report Inappropriate Content
@giorgiokatr wrote:
wrong rank in negative values
when i select sector and area hierarchy rank for negative values (category bikes) goes wrong
after branch 6 branch 2 should have rank 2
also rank should start from 4
see attached pbix
https://drive.google.com/open?id=0Bw-_YmJ3Q49gTnpKTnQzNktTZ1k
@giorgiokatr wrote:
wrong rank in negative values
when i select sector and area hierarchy rank for negative values (category bikes) goes wrong
after branch 6 branch 2 should have rank 2
also rank should start from 4
see attached pbix
https://drive.google.com/open?id=0Bw-_YmJ3Q49gTnpKTnQzNktTZ1k
Even with the attached pbix file, your description is not clear for me. Could you show the expected output with some snapshots?
- Mark as New
- Bookmark
- Subscribe
- Mute
- Subscribe to RSS Feed
- Permalink
- Report Inappropriate Content
- Mark as New
- Bookmark
- Subscribe
- Mute
- Subscribe to RSS Feed
- Permalink
- Report Inappropriate Content
In order to better understand you issue please share how are you claculating the rank.
- Mark as New
- Bookmark
- Subscribe
- Mute
- Subscribe to RSS Feed
- Permalink
- Report Inappropriate Content
i want to calculate sales so i created a measure
salesamount = CALCULATE(SUM(Table1[sales]))
then i used
Rank = RANKX(ALL(Table1[branch]),CALCULATE([salesamount],ALLEXCEPT(Table1,Table1[branch],Table1[area],Table1[sector])),,ASC,Dense)
the "hierarchy" in matrix rows is sector>area>branch
but rank is wrong for negative when i filter for example sector or area in slicers
i also used
RANKX(ALL(Table1[branch]),CALCULATE([salesamount]),,ASC,Dense)
but same problem
rank goes 1,2 then in negative values rank is 4 instead of 3
this happen when i filter with a slicer
all branch rank (unfiltered area and sector ) is right
- Mark as New
- Bookmark
- Subscribe
- Mute
- Subscribe to RSS Feed
- Permalink
- Report Inappropriate Content
@giorgiokatr you might need to nest the formula with hasonevalue( ).
See this really nice post from @Anonymous http://community.powerbi.com/t5/Desktop/Using-RankX-in-DAX-For-PowerPivot-PowerBI/m-p/42824
Take this example:
Rank by visible = if (
                       HASONEVALUE(temp[cat]),
					   RANKX(ALLSELECTED(temp[cat]),[Total USD],,ASC,Dense)
					   )
- Mark as New
- Bookmark
- Subscribe
- Mute
- Subscribe to RSS Feed
- Permalink
- Report Inappropriate Content
thanks @Bordalos it works ok but the problem is when you have an upper hierarchy in the cat and you filter it.
example
try this in a power bi
and create two slicers one for first cat and a second for cat
if you filter by first cat (example first cat =1)
u will see wrong rank for
RANKX(ALLSELECTED(temp[cat]),[Total USD],,ASC,Dense)
| first cat | cat | Total USD |
| 1 | a | 50 |
| 1 | b | 20 |
| 1 | c | -10 |
| 2 | d | -20 |
- Mark as New
- Bookmark
- Subscribe
- Mute
- Subscribe to RSS Feed
- Permalink
- Report Inappropriate Content
@giorgiokatr what about :
First create a measure to sum [Total USD], like :
Sum_USD = SUM(temp[Total USD])
Then rank all table and use the last measure as expression:
Rank = RANKX(ALLSELECTED(temp),[Sum_USD],,ASC,Dense)
No filters applied
Filter
cat = {a,b}
filter
firstCat={1} and
cat={b,c}
In this way you will rank the values according to what is selected.
- Mark as New
- Bookmark
- Subscribe
- Mute
- Subscribe to RSS Feed
- Permalink
- Report Inappropriate Content
- Mark as New
- Bookmark
- Subscribe
- Mute
- Subscribe to RSS Feed
- Permalink
- Report Inappropriate Content
Helpful resources

Microsoft Fabric Learn Together
Covering the world! 9:00-10:30 AM Sydney, 4:00-5:30 PM CET (Paris/Berlin), 7:00-8:30 PM Mexico City

Power BI Monthly Update - April 2024
Check out the April 2024 Power BI update to learn about new features.

| User | Count |
|---|---|
| 108 | |
| 100 | |
| 78 | |
| 64 | |
| 58 |
| User | Count |
|---|---|
| 148 | |
| 111 | |
| 94 | |
| 84 | |
| 67 |


