- Power BI forums
- Updates
- News & Announcements
- Get Help with Power BI
- Desktop
- Service
- Report Server
- Power Query
- Mobile Apps
- Developer
- DAX Commands and Tips
- Custom Visuals Development Discussion
- Health and Life Sciences
- Power BI Spanish forums
- Translated Spanish Desktop
- Power Platform Integration - Better Together!
- Power Platform Integrations (Read-only)
- Power Platform and Dynamics 365 Integrations (Read-only)
- Training and Consulting
- Instructor Led Training
- Dashboard in a Day for Women, by Women
- Galleries
- Community Connections & How-To Videos
- COVID-19 Data Stories Gallery
- Themes Gallery
- Data Stories Gallery
- R Script Showcase
- Webinars and Video Gallery
- Quick Measures Gallery
- 2021 MSBizAppsSummit Gallery
- 2020 MSBizAppsSummit Gallery
- 2019 MSBizAppsSummit Gallery
- Events
- Ideas
- Custom Visuals Ideas
- Issues
- Issues
- Events
- Upcoming Events
- Community Blog
- Power BI Community Blog
- Custom Visuals Community Blog
- Community Support
- Community Accounts & Registration
- Using the Community
- Community Feedback
Register now to learn Fabric in free live sessions led by the best Microsoft experts. From Apr 16 to May 9, in English and Spanish.
- Power BI forums
- Forums
- Get Help with Power BI
- Desktop
- Re: weighted average for survey result
- Subscribe to RSS Feed
- Mark Topic as New
- Mark Topic as Read
- Float this Topic for Current User
- Bookmark
- Subscribe
- Printer Friendly Page
- Mark as New
- Bookmark
- Subscribe
- Mute
- Subscribe to RSS Feed
- Permalink
- Report Inappropriate Content
weighted average for survey result
Hi all,
I would really appreciate your help with the following.
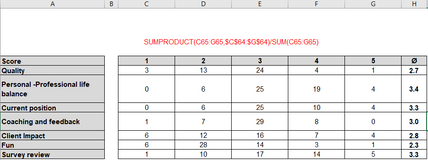
I have some figures as in the following excel example.
The figure in this screenshot it is just count of respondent answers for spesific question with different evalution rate(1,2,3,4,5)
what I need to find Weighted Average for different question category,in excel it is easy to calculated using by SUMPRODUCT(example calculation for Quality survey question(1x3+13x2+3x24+4x4+5x1)/number of respondents(45 pers)=2.7
but with DAX it seems to me more complicated
Would be so nice to hearing by your side.
Solved! Go to Solution.
- Mark as New
- Bookmark
- Subscribe
- Mute
- Subscribe to RSS Feed
- Permalink
- Report Inappropriate Content
Hi,
In the column area section of the visual, drag the Value field from the reporting PulseCheckSurvey table. In the file that you shared with me over a private message, this formula work perfectly
=IF(HASONEVALUE('reporting PulseCheckSurvey'[Value]),[Number of Respondents],SUMX(SUMMARIZE(VALUES('reporting PulseCheckSurvey'[Value]),[Value],"ABCD",MIN('reporting PulseCheckSurvey'[Value]),"EFGH",[Number of Respondents]),([ABCD]*[EFGH]))/[Number of Respondents])
Hope this helps.
Regards,
Ashish Mathur
http://www.ashishmathur.com
https://www.linkedin.com/in/excelenthusiasts/
- Mark as New
- Bookmark
- Subscribe
- Mute
- Subscribe to RSS Feed
- Permalink
- Report Inappropriate Content
Hi Ashish,
Hope you are well! I have a build on this thread and have data from different question types (binary - yes/ no, Likert - 7pt and 9pt scales, location close coded responses - choose which country & city etc.) So while I can work out the unweighted averages, the formula above does not work if I want to create a measure for weighted data for every column, how would you suggest to do that?
I have attached an excerpt of the data sheet.
Thanks in advance!
| UNIQUE FILE NAME | Country | Testing Location # | Question # (L7/L10) | Test Brand | Assigned Cell | Participant ID | Date | Language | User Type (Core vs. Prospect) | First Like Score (L1) | Second Like Score (L2) | Satisfaction Score (N12) | Lemon-Lime / Orange | Diet / Regular | Sweetness Level | Carbonation Level |
| 143I9187D10665EO | Kenya | Nairobi - Sarit | L7 | Brand A | C | 2839863538 | 2022-02-03 | English | Core | 8 | 7 | 6 | Orange | Regular | Not mentioned | Yes |
| 348O4243X87055CU | Kenya | Nairobi - Sarit | L7 | Brand A | C | 2955021462 | 2022-02-03 | English | Core | 9 | 9 | 9 | Lemon-Lime | Regular | Sweet | Yes |
| 199Y4413B73708FT | China | Shanghai | L7 | Brand B | C | 5682079760 | 2022-02-03 | English | Core | 8 | 9 | 10 | Lemon-Lime | Diet | Sweet | Yes |
| 570L1507V48639ON | Kenya | Nairobi - Sarit | L7 | Brand A | F | 2275106417 | 2022-02-03 | English | Core | 8 | 8 | 11 | Lemon-Lime | Regular | Just right | Not mentioned |
| 504R8276M53107AF | Kenya | Nairobi - Sarit | L7 | Brand A | F | 2628949276 | 2022-02-03 | English | Core | 8 | 8 | 9 | Orange | Regular | Too sweet | Yes |
| 746O2369I70887CU | China | Beijing | L7 | Brand B | F | 8742792105 | 2022-02-03 | English | Prospect | 9 | 9 | 11 | Lemon-Lime | Regular | Sweet | Not mentioned |
| 448K6964P62186RV | Kenya | Nairobi - Sarit | L7 | Brand A | FP | 5778456733 | 2022-02-03 | English | Core | 9 | 9 | 10 | Lemon-Lime | Diet | Sweet | Yes |
| 768X7665Q71962OF | Kenya | Nairobi - Sarit | L7 | Brand A | FP | 5831185774 | 2022-02-03 | English | Core | 9 | 9 | 11 | Orange | Regular | Sweet | Not mentioned |
| 492A5083R30542RC | Kenya | Nairobi - Sarit | L7 | Brand B | FP | 8660449532 | 2022-02-03 | English | Core | 8 | 8 | 9 | Lemon-Lime | Regular | Sweet | Not mentioned |
| 293A2047V54660BJ | Kenya | Nairobi - Sarit | L7 | Brand B | FP | 7264814069 | 2022-02-03 | English | Prospect | 6 | 7 | 9 | Orange | Regular | ||
| 312X8609N27744TQ | Australia | Melbourne | L10 | Brand A | C | 1085029725 | 2022-02-03 | English | Core | 6 | 8 | 9 | Lemon-Lime | Regular | ||
| 241E8133H99505FU | Austraia | Sydney | L7 | Brand A | C | 9163102393 | 2022-02-03 | English | Core | 7 | 9 | 10 | Lemon-Lime | Regular | Not too sweet | No |
| 893A4354I83561QG | Kenya | Nairobi - Rio | L7 | Brand B | FP | 3946826779 | 2022-02-03 | English | Core | 9 | 9 | 11 | Orange | Diet | Not mentioned | Yes |
| 903R4639E91919HF | India | Lucknow | L10 | Brand A | FP | 6168857119 | 2022-02-03 | Hindi | Core | 8 | 9 | 11 | Lemon-Lime | Regular | Just right | Not mentioned |
| 717J9486U70243CI | India | Lucknow | L7 | Brand B | C | 5603485577 | 2022-02-04 | Hindi | Core | 9 | 9 | 11 | Orange | Regular | Just right | No |
- Mark as New
- Bookmark
- Subscribe
- Mute
- Subscribe to RSS Feed
- Permalink
- Report Inappropriate Content
Hi,
I cannot understand your question. In a Table form, show the exact result you are expecting.
Regards,
Ashish Mathur
http://www.ashishmathur.com
https://www.linkedin.com/in/excelenthusiasts/
- Mark as New
- Bookmark
- Subscribe
- Mute
- Subscribe to RSS Feed
- Permalink
- Report Inappropriate Content
Hi Ashish, Apologies for not being clear about the ask. While I can't share the complete data file as it has 50K records, it is sensitive and have appended other queries to the core table, I will try and elaborate a bit more on the table above.
If we take the first liked score column, this was a question asked of the respondents to rate thier first sip on a 9 point scale (e.g. on a scale of 1-9 how would you rate your first sip?) the values that you are seeing are the score each respondent gave for the first sip. So I have calculated the total sample (base Size) using COUNTROWS DAX in the first column Unique file name and then calculated unweighted % using the DAX = DIVIDE([BaseSize], CALCULATE([BaseSize],ALL(Sheet1)))*100 (Sheet1 is the excerpt I shared earlier). So I have calculated unweighted data % but what I am struggling with is to calculate weighted %. In other words, what is the weighted % of the testing location (which is text based) or what is the weighted % of first liked score or second liked score etc.
Is there a way to calculate the weighted data for all the columns?
Hope that makes sense! I am happy to do a screen share and show you what I am working with on a video call but fully understand if you don't want to do that.
Thanks in advance for your help
Bala
- Mark as New
- Bookmark
- Subscribe
- Mute
- Subscribe to RSS Feed
- Permalink
- Report Inappropriate Content
Based on the data that you shared, show the expected result very clearly. It will be ideal if you can share the download link of an MS Excel file with 2 tabs - input data and expected result.
Regards,
Ashish Mathur
http://www.ashishmathur.com
https://www.linkedin.com/in/excelenthusiasts/
- Mark as New
- Bookmark
- Subscribe
- Mute
- Subscribe to RSS Feed
- Permalink
- Report Inappropriate Content
Hi,
This is not difficult in DAX. One has to use the SUMX() function. Share your dataset.
Regards,
Ashish Mathur
http://www.ashishmathur.com
https://www.linkedin.com/in/excelenthusiasts/
- Mark as New
- Bookmark
- Subscribe
- Mute
- Subscribe to RSS Feed
- Permalink
- Report Inappropriate Content
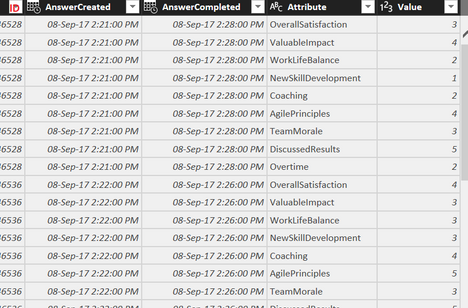
HI, please this is my dataset, in my calculation for number of candidates in second picutre, I have used distincount
- Mark as New
- Bookmark
- Subscribe
- Mute
- Subscribe to RSS Feed
- Permalink
- Report Inappropriate Content
Hi,
Not very sure but try this
=IF(HASONEVALUE(Data[Value]),your_measure,SUMX(SUMMARIZE(VALUES(Data[Value]),[Value],"ABCD",MIN(Data[Value]),"EFGH",your_measure,"IJKL",[ABCD]*[EFGH]),[IJKL]/your_measure))
If this does not work, then share the link from where i can download your file.
Regards,
Ashish Mathur
http://www.ashishmathur.com
https://www.linkedin.com/in/excelenthusiasts/
- Mark as New
- Bookmark
- Subscribe
- Mute
- Subscribe to RSS Feed
- Permalink
- Report Inappropriate Content
Hi,
In the column area section of the visual, drag the Value field from the reporting PulseCheckSurvey table. In the file that you shared with me over a private message, this formula work perfectly
=IF(HASONEVALUE('reporting PulseCheckSurvey'[Value]),[Number of Respondents],SUMX(SUMMARIZE(VALUES('reporting PulseCheckSurvey'[Value]),[Value],"ABCD",MIN('reporting PulseCheckSurvey'[Value]),"EFGH",[Number of Respondents]),([ABCD]*[EFGH]))/[Number of Respondents])
Hope this helps.
Regards,
Ashish Mathur
http://www.ashishmathur.com
https://www.linkedin.com/in/excelenthusiasts/
- Mark as New
- Bookmark
- Subscribe
- Mute
- Subscribe to RSS Feed
- Permalink
- Report Inappropriate Content
Dear Mathur,
Thanks for your help.It works perfectly
Have a nice fruitful day
Helpful resources

Microsoft Fabric Learn Together
Covering the world! 9:00-10:30 AM Sydney, 4:00-5:30 PM CET (Paris/Berlin), 7:00-8:30 PM Mexico City

Power BI Monthly Update - April 2024
Check out the April 2024 Power BI update to learn about new features.

| User | Count |
|---|---|
| 114 | |
| 101 | |
| 78 | |
| 75 | |
| 49 |
| User | Count |
|---|---|
| 145 | |
| 108 | |
| 107 | |
| 89 | |
| 61 |


