- Power BI forums
- Updates
- News & Announcements
- Get Help with Power BI
- Desktop
- Service
- Report Server
- Power Query
- Mobile Apps
- Developer
- DAX Commands and Tips
- Custom Visuals Development Discussion
- Health and Life Sciences
- Power BI Spanish forums
- Translated Spanish Desktop
- Power Platform Integration - Better Together!
- Power Platform Integrations (Read-only)
- Power Platform and Dynamics 365 Integrations (Read-only)
- Training and Consulting
- Instructor Led Training
- Dashboard in a Day for Women, by Women
- Galleries
- Community Connections & How-To Videos
- COVID-19 Data Stories Gallery
- Themes Gallery
- Data Stories Gallery
- R Script Showcase
- Webinars and Video Gallery
- Quick Measures Gallery
- 2021 MSBizAppsSummit Gallery
- 2020 MSBizAppsSummit Gallery
- 2019 MSBizAppsSummit Gallery
- Events
- Ideas
- Custom Visuals Ideas
- Issues
- Issues
- Events
- Upcoming Events
- Community Blog
- Power BI Community Blog
- Custom Visuals Community Blog
- Community Support
- Community Accounts & Registration
- Using the Community
- Community Feedback
Register now to learn Fabric in free live sessions led by the best Microsoft experts. From Apr 16 to May 9, in English and Spanish.
- Power BI forums
- Forums
- Get Help with Power BI
- Desktop
- "Analyze" button missing on graphic
- Subscribe to RSS Feed
- Mark Topic as New
- Mark Topic as Read
- Float this Topic for Current User
- Bookmark
- Subscribe
- Printer Friendly Page
- Mark as New
- Bookmark
- Subscribe
- Mute
- Subscribe to RSS Feed
- Permalink
- Report Inappropriate Content
"Analyze" button missing on graphic
Hi,
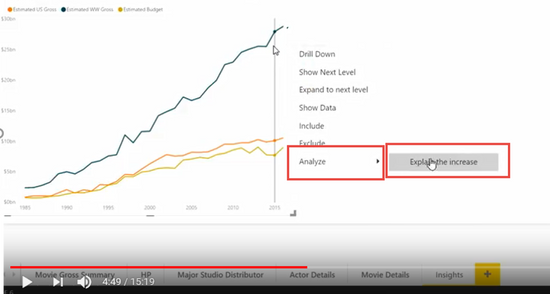
I have a dashboard that I am working with, and would like to use the Analyze button that I saw in a youtube clip can be used to get Quick Insights into a specific query. So basically in the video it showed a graphic like this, where when you hover your mouse on a specific point, and right click, you can Analyze the point to see why the field increased so much:
However, when I am in my own Power BI report, I cannot do this. I have tried both on my Desktop version and on the online report. This is what happens to me:
So the Analyze button is missing. What is it I need to do to enable this? I just downloaded Desktop anew, so I should have the most up-to-date version.
Solved! Go to Solution.
- Mark as New
- Bookmark
- Subscribe
- Mute
- Subscribe to RSS Feed
- Permalink
- Report Inappropriate Content
There are some limitations regarding using the Analyze functionlity. You can view this link https://docs.microsoft.com/en-us/power-bi/desktop-insights to see if one of the conditions are not met.
- Mark as New
- Bookmark
- Subscribe
- Mute
- Subscribe to RSS Feed
- Permalink
- Report Inappropriate Content
Hi,
There are certain conditions and limitations to apply Increase or decrease:
The following list is the collection of currently unsupported scenarios are:
- TopN filters
- Include/exclude filters
- Measure filters
- Non-numeric measures
- Use of "Show value as"
- Filtered measures - filtered measures are visual level calculations with a specific filter applied (for example, Total Sales for France), and are used on some of the visuals created by the insights feature
- Categorical columns on X-axis unless it defines a sort by column that is scalar. If using a hierarchy, then every column in the active hierarchy has to match this condition
- RLS or OLS enabled data models
In addition, the following model types and data sources are currently not supported for insights:
- DirectQuery
- Live connect
- On-premises Reporting Services
- Embedding
- Mark as New
- Bookmark
- Subscribe
- Mute
- Subscribe to RSS Feed
- Permalink
- Report Inappropriate Content
There are some limitations regarding using the Analyze functionlity. You can view this link https://docs.microsoft.com/en-us/power-bi/desktop-insights to see if one of the conditions are not met.
- Mark as New
- Bookmark
- Subscribe
- Mute
- Subscribe to RSS Feed
- Permalink
- Report Inappropriate Content
Hi,
Thanks! I'm not quite sure what condition I am not meeting, but I am guessing that this answer is correct anyhows. I will look further into it, but mark this as complete. Thanks!
Helpful resources

Microsoft Fabric Learn Together
Covering the world! 9:00-10:30 AM Sydney, 4:00-5:30 PM CET (Paris/Berlin), 7:00-8:30 PM Mexico City

Power BI Monthly Update - April 2024
Check out the April 2024 Power BI update to learn about new features.

| User | Count |
|---|---|
| 111 | |
| 94 | |
| 83 | |
| 67 | |
| 59 |
| User | Count |
|---|---|
| 151 | |
| 121 | |
| 104 | |
| 87 | |
| 67 |


