- Power BI forums
- Updates
- News & Announcements
- Get Help with Power BI
- Desktop
- Service
- Report Server
- Power Query
- Mobile Apps
- Developer
- DAX Commands and Tips
- Custom Visuals Development Discussion
- Health and Life Sciences
- Power BI Spanish forums
- Translated Spanish Desktop
- Power Platform Integration - Better Together!
- Power Platform Integrations (Read-only)
- Power Platform and Dynamics 365 Integrations (Read-only)
- Training and Consulting
- Instructor Led Training
- Dashboard in a Day for Women, by Women
- Galleries
- Community Connections & How-To Videos
- COVID-19 Data Stories Gallery
- Themes Gallery
- Data Stories Gallery
- R Script Showcase
- Webinars and Video Gallery
- Quick Measures Gallery
- 2021 MSBizAppsSummit Gallery
- 2020 MSBizAppsSummit Gallery
- 2019 MSBizAppsSummit Gallery
- Events
- Ideas
- Custom Visuals Ideas
- Issues
- Issues
- Events
- Upcoming Events
- Community Blog
- Power BI Community Blog
- Custom Visuals Community Blog
- Community Support
- Community Accounts & Registration
- Using the Community
- Community Feedback
Register now to learn Fabric in free live sessions led by the best Microsoft experts. From Apr 16 to May 9, in English and Spanish.
- Power BI forums
- Forums
- Get Help with Power BI
- Desktop
- need 2 Slicers for one line chart, one for column ...
- Subscribe to RSS Feed
- Mark Topic as New
- Mark Topic as Read
- Float this Topic for Current User
- Bookmark
- Subscribe
- Printer Friendly Page
- Mark as New
- Bookmark
- Subscribe
- Mute
- Subscribe to RSS Feed
- Permalink
- Report Inappropriate Content
need 2 Slicers for one line chart, one for column and one for row
Hello,
I am new to Power BI and faced with this problem which will need your help to fix it.
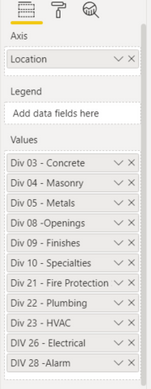
I have a chart report ( Below Picture) which is related to Map too.
which is based on Project locations and different divisions,
I already have a slicer for locations,
but want to have another slicer for divisions (value)
I was able to make a second slicer ( for column) and it works till I just choose one item on the slicer ( just one division) ,
as soon as choosing another division it will not work correctly.
please let me know how can I make a slicer for columns of a table, based on Multi selection. (much appreciated)
the way I used till now is :
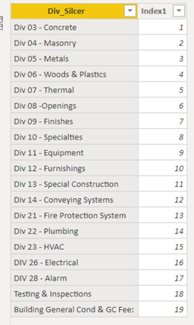
- I made a new table for the division list which can apply slicer on that

- then made a new measure for each column
for instance :
Solved! Go to Solution.
- Mark as New
- Bookmark
- Subscribe
- Mute
- Subscribe to RSS Feed
- Permalink
- Report Inappropriate Content
Hi @B_Vatani ,
This table is not unpivot you need to have the information in the following way:
To do it with DAX you need to create a measure similar to this:
DIVISION TOTAL = SWITCH(SELECTEDVALUE(Divsion[Division]);
                        "DIV 1"; SUM('DAX'[Div 1]);
                        "DIV 2"; SUM('DAX'[Div 2]);
                        "DIV 3"; SUM('DAX'[Div 3]);
                        "DIV 4"; SUM('DAX'[Div 4])
                    )
Then use the division table has a legend.
Check PBIX file with both options.
Regards
Miguel Félix
Did I answer your question? Mark my post as a solution!
Proud to be a Super User!
Check out my blog: Power BI em Português- Mark as New
- Bookmark
- Subscribe
- Mute
- Subscribe to RSS Feed
- Permalink
- Report Inappropriate Content
Hi @B_Vatani,
As MFelix said, your table structure not suitable to do these.
You can 'unpivot columns' on your fields to convert them to attribute and value then it should more simple to coding formulas.
Please check the following blog to know how to create a dynamic attribute filter to interact with the chart graph:
Dynamic Attributes In A Power BI Report
Regards,
Xiaoxin Sheng
If this post helps, please consider accept as solution to help other members find it more quickly.
- Mark as New
- Bookmark
- Subscribe
- Mute
- Subscribe to RSS Feed
- Permalink
- Report Inappropriate Content
Hi @B_Vatani ,
To what I can understand you have a column for each division believe that the best option is to use the unpivot option on the query editor and then place the division on the slicer and also on the legend of your chart.
Assuming that your data is like this
Div1 - Div2 - Div3 - Div4
10 - 20 - 30 - 40
If you select allthe columns and unpivot you will get the following table:
Attribute - Value
Div1 - 10
DIv2 - 20
Div3 - 30
Div4 - 40
Now just use the attribute for the legend and values for the values.
Much easier and no need to have DAX.
Regards
Miguel Félix
Did I answer your question? Mark my post as a solution!
Proud to be a Super User!
Check out my blog: Power BI em Português- Mark as New
- Bookmark
- Subscribe
- Mute
- Subscribe to RSS Feed
- Permalink
- Report Inappropriate Content
Felix,
thanks for your response,
but unfortunately, this is not the solution to this problem,
my table already includes unpivot.
my table is like :
location Div1 - Div2 - Div3 - Div4
City 1 10 - 20 - 30 - 40
City 2 100 - 20 - 20 - 40
City 3 10 - 20 - 30 - 40
City 4 10 - 20 - 30 - 40
I need 2 Slicrera at the same time on Divison and City.
there is no easy way unless as I said before to solve it with DAX,
I will appreciate it if you can help to write DAX as I explained in the main message.
Thanks again,
- Mark as New
- Bookmark
- Subscribe
- Mute
- Subscribe to RSS Feed
- Permalink
- Report Inappropriate Content
Hi @B_Vatani ,
This table is not unpivot you need to have the information in the following way:
To do it with DAX you need to create a measure similar to this:
DIVISION TOTAL = SWITCH(SELECTEDVALUE(Divsion[Division]);
                        "DIV 1"; SUM('DAX'[Div 1]);
                        "DIV 2"; SUM('DAX'[Div 2]);
                        "DIV 3"; SUM('DAX'[Div 3]);
                        "DIV 4"; SUM('DAX'[Div 4])
                    )
Then use the division table has a legend.
Check PBIX file with both options.
Regards
Miguel Félix
Did I answer your question? Mark my post as a solution!
Proud to be a Super User!
Check out my blog: Power BI em Português- Mark as New
- Bookmark
- Subscribe
- Mute
- Subscribe to RSS Feed
- Permalink
- Report Inappropriate Content
Thank you So much Felix!
you were right about unpivot.
I did all columns together because of that it was not like what you explained,
thank you for explaining that.
I tried both but finally, I used the DAX, since if I unpivot the data since I am using that data on several other reports, makes it difficult to work on other reports.
thanks again
Helpful resources

Microsoft Fabric Learn Together
Covering the world! 9:00-10:30 AM Sydney, 4:00-5:30 PM CET (Paris/Berlin), 7:00-8:30 PM Mexico City

Power BI Monthly Update - April 2024
Check out the April 2024 Power BI update to learn about new features.

| User | Count |
|---|---|
| 112 | |
| 97 | |
| 84 | |
| 67 | |
| 60 |
| User | Count |
|---|---|
| 150 | |
| 120 | |
| 99 | |
| 87 | |
| 68 |


