- Power BI forums
- Updates
- News & Announcements
- Get Help with Power BI
- Desktop
- Service
- Report Server
- Power Query
- Mobile Apps
- Developer
- DAX Commands and Tips
- Custom Visuals Development Discussion
- Health and Life Sciences
- Power BI Spanish forums
- Translated Spanish Desktop
- Power Platform Integration - Better Together!
- Power Platform Integrations (Read-only)
- Power Platform and Dynamics 365 Integrations (Read-only)
- Training and Consulting
- Instructor Led Training
- Dashboard in a Day for Women, by Women
- Galleries
- Community Connections & How-To Videos
- COVID-19 Data Stories Gallery
- Themes Gallery
- Data Stories Gallery
- R Script Showcase
- Webinars and Video Gallery
- Quick Measures Gallery
- 2021 MSBizAppsSummit Gallery
- 2020 MSBizAppsSummit Gallery
- 2019 MSBizAppsSummit Gallery
- Events
- Ideas
- Custom Visuals Ideas
- Issues
- Issues
- Events
- Upcoming Events
- Community Blog
- Power BI Community Blog
- Custom Visuals Community Blog
- Community Support
- Community Accounts & Registration
- Using the Community
- Community Feedback
Register now to learn Fabric in free live sessions led by the best Microsoft experts. From Apr 16 to May 9, in English and Spanish.
- Power BI forums
- Forums
- Get Help with Power BI
- Desktop
- Re: measure as a filter
- Subscribe to RSS Feed
- Mark Topic as New
- Mark Topic as Read
- Float this Topic for Current User
- Bookmark
- Subscribe
- Printer Friendly Page
- Mark as New
- Bookmark
- Subscribe
- Mute
- Subscribe to RSS Feed
- Permalink
- Report Inappropriate Content
measure as a filter
Hello,
I am stuck on the following problem. Please help.
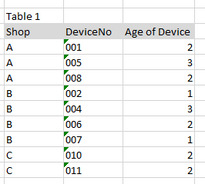
Table 1 contains:
My sales data is from a measure - from Table 2 (which I am able to do) is like:
My desired output is showing count of device at shop that has no sales.
I was trying to put into a matrix, but as soon as I put shop as row and even sales =0 as filter, all shops data shows regardless has sales or not.
Any help is appreciated.
Solved! Go to Solution.
- Mark as New
- Bookmark
- Subscribe
- Mute
- Subscribe to RSS Feed
- Permalink
- Report Inappropriate Content
Hi @Anonymous
I've updated the PBIX file from that simple model and have it working as I think you need.
Bascially I've added a +0 to the end to the end of the sales measure and also was careful about which shop field to use in my matrix. I use the field from Table2 rather than Table1
https://1drv.ms/u/s!AtDlC2rep7a-oBnYHCJluU2V97bz
- Mark as New
- Bookmark
- Subscribe
- Mute
- Subscribe to RSS Feed
- Permalink
- Report Inappropriate Content
I use [Table 2] to effectively operate as a dimenstion table (one row per shop and now more). Which allows me to create a relationship with [Table1] and [Sales] that have many lines for each shop.
Otherwise you can't have a relationship between [Sales] and [Table2] and need to rely on some pretty in-efficient methods to create the calcualtion.
- Mark as New
- Bookmark
- Subscribe
- Mute
- Subscribe to RSS Feed
- Permalink
- Report Inappropriate Content
HI @Anonymous
I managed to get it to work as fas as I understand you need to.
Is the Sales column in Table 2 and actual column or a calculated measure?
Here is the very basic PBIX File I mocked up
https://1drv.ms/u/s!AtDlC2rep7a-oBnYHCJluU2V97bz
- Mark as New
- Bookmark
- Subscribe
- Mute
- Subscribe to RSS Feed
- Permalink
- Report Inappropriate Content
Thanks for your reply.
Sales info is a calculated measure from another table. (Basically, it is just sum of sales group by Shop to be shown).
- Mark as New
- Bookmark
- Subscribe
- Mute
- Subscribe to RSS Feed
- Permalink
- Report Inappropriate Content
Hi @Anonymous
I've updated the PBIX file from that simple model and have it working as I think you need.
Bascially I've added a +0 to the end to the end of the sales measure and also was careful about which shop field to use in my matrix. I use the field from Table2 rather than Table1
https://1drv.ms/u/s!AtDlC2rep7a-oBnYHCJluU2V97bz
- Mark as New
- Bookmark
- Subscribe
- Mute
- Subscribe to RSS Feed
- Permalink
- Report Inappropriate Content
Thanks.
I am a bit confused with your 3 tables approach now.
Basically, I have Sales and Table 1, I am not sure how to create Table 2 and what is the purpose of it.
Is it possible to get the same result with only Sales and Table 1?
- Mark as New
- Bookmark
- Subscribe
- Mute
- Subscribe to RSS Feed
- Permalink
- Report Inappropriate Content
I use [Table 2] to effectively operate as a dimenstion table (one row per shop and now more). Which allows me to create a relationship with [Table1] and [Sales] that have many lines for each shop.
Otherwise you can't have a relationship between [Sales] and [Table2] and need to rely on some pretty in-efficient methods to create the calcualtion.
Helpful resources

Microsoft Fabric Learn Together
Covering the world! 9:00-10:30 AM Sydney, 4:00-5:30 PM CET (Paris/Berlin), 7:00-8:30 PM Mexico City

Power BI Monthly Update - April 2024
Check out the April 2024 Power BI update to learn about new features.

| User | Count |
|---|---|
| 111 | |
| 95 | |
| 77 | |
| 69 | |
| 52 |
| User | Count |
|---|---|
| 146 | |
| 109 | |
| 106 | |
| 88 | |
| 61 |


