- Power BI forums
- Updates
- News & Announcements
- Get Help with Power BI
- Desktop
- Service
- Report Server
- Power Query
- Mobile Apps
- Developer
- DAX Commands and Tips
- Custom Visuals Development Discussion
- Health and Life Sciences
- Power BI Spanish forums
- Translated Spanish Desktop
- Power Platform Integration - Better Together!
- Power Platform Integrations (Read-only)
- Power Platform and Dynamics 365 Integrations (Read-only)
- Training and Consulting
- Instructor Led Training
- Dashboard in a Day for Women, by Women
- Galleries
- Community Connections & How-To Videos
- COVID-19 Data Stories Gallery
- Themes Gallery
- Data Stories Gallery
- R Script Showcase
- Webinars and Video Gallery
- Quick Measures Gallery
- 2021 MSBizAppsSummit Gallery
- 2020 MSBizAppsSummit Gallery
- 2019 MSBizAppsSummit Gallery
- Events
- Ideas
- Custom Visuals Ideas
- Issues
- Issues
- Events
- Upcoming Events
- Community Blog
- Power BI Community Blog
- Custom Visuals Community Blog
- Community Support
- Community Accounts & Registration
- Using the Community
- Community Feedback
Register now to learn Fabric in free live sessions led by the best Microsoft experts. From Apr 16 to May 9, in English and Spanish.
- Power BI forums
- Forums
- Get Help with Power BI
- Desktop
- issue with relationships between 3 tables
- Subscribe to RSS Feed
- Mark Topic as New
- Mark Topic as Read
- Float this Topic for Current User
- Bookmark
- Subscribe
- Printer Friendly Page
- Mark as New
- Bookmark
- Subscribe
- Mute
- Subscribe to RSS Feed
- Permalink
- Report Inappropriate Content
issue with relationships between 3 tables
Hi,
I try to create some relationships between tables in Power BI. But I always get an error. To understand that error I have created the following example, but I don t understand, why I get the error.
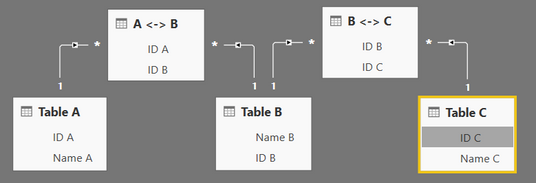
I have the three tables:
- Table A with the Items A1 (ID 1) and A2 (ID 2)
- Table B with the Items B1 (ID 1) and B2 (ID 2)
- Table C with the Items C1 (ID 1) and C2 (ID 2)
and the two tables:
- A <-> B (links table A with table B)
- B <-> C (links table B with table C)
Now I create in Power BI the relationships between the Table, as shown in the following picture.
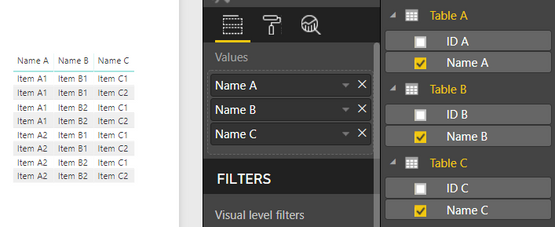
Then I create a Table visual and drag the fields Name A, Name B and Name C to the Values field. What I expect to get is the following visualisation.
But what happens instead is, that I get the Error
Can t determine relationships between the fields
Can t display the data because Power BI can t determine the relationship between two or more fields.
And if I try to Export the Data, I get the Error
Data exceeds the limit
Your data is too large. Some data sampling may occur.
But if I change Name C to Count of Name C, it works fine.
Does anyone know why this happens, or what I have to change?
Thank you!
Andre
Solved! Go to Solution.
- Mark as New
- Bookmark
- Subscribe
- Mute
- Subscribe to RSS Feed
- Permalink
- Report Inappropriate Content
Hi @Puero1
With the relationship you created, you can select correct values from Table A and Table B or Table C and Table B to the “table” chart, but when you add values from the other table, it returns an error like “it can’t determine the relationship between two or more fields”.
For example, for 1 from Table A, it can relate 1 or 2 from Table B, since 1 from Table B can also relate 1 or 2 from Table C, so for 1 from Table A, it can’t determine whether 1 or 2 from Table C should be refer to
Table A Table B Table C
1 1 1,2
1 2 1,2
To get which you want as shown in the picture,
You can create a new table with the formula
Table = CROSSJOIN(TableA,TableB,TableC)
Best Regards
Maggie
- Mark as New
- Bookmark
- Subscribe
- Mute
- Subscribe to RSS Feed
- Permalink
- Report Inappropriate Content
Hi @Puero1
Does "ID A" in Table A and "ID B" in Table B has distinct value and they can match each other? How does Table A <-> B look, could you show example data structure?
Best Regards
Maggie
- Mark as New
- Bookmark
- Subscribe
- Mute
- Subscribe to RSS Feed
- Permalink
- Report Inappropriate Content
Hi Maggie,
thanks for your reply. Yes they have distinct values and can match each other.
I made a screenshot with all values from all tables. These few values are enough for me to reproduce the error message.
Best Regards
André
- Mark as New
- Bookmark
- Subscribe
- Mute
- Subscribe to RSS Feed
- Permalink
- Report Inappropriate Content
Hi @Puero1
With the relationship you created, you can select correct values from Table A and Table B or Table C and Table B to the “table” chart, but when you add values from the other table, it returns an error like “it can’t determine the relationship between two or more fields”.
For example, for 1 from Table A, it can relate 1 or 2 from Table B, since 1 from Table B can also relate 1 or 2 from Table C, so for 1 from Table A, it can’t determine whether 1 or 2 from Table C should be refer to
Table A Table B Table C
1 1 1,2
1 2 1,2
To get which you want as shown in the picture,
You can create a new table with the formula
Table = CROSSJOIN(TableA,TableB,TableC)
Best Regards
Maggie
- Mark as New
- Bookmark
- Subscribe
- Mute
- Subscribe to RSS Feed
- Permalink
- Report Inappropriate Content
Hi Maggie @v-juanli-msft
As a design pattern, is it correct to define custom calculated tables as you have suggested and use them in visuals, whenever default data model cannot produce the results we want?
- Mark as New
- Bookmark
- Subscribe
- Mute
- Subscribe to RSS Feed
- Permalink
- Report Inappropriate Content
Hi @v-juanli-msft,
thanks, now I understand the error. The CROSSJOIN works perfect for me. ![]()
Best Regards
André
Helpful resources

Microsoft Fabric Learn Together
Covering the world! 9:00-10:30 AM Sydney, 4:00-5:30 PM CET (Paris/Berlin), 7:00-8:30 PM Mexico City

Power BI Monthly Update - April 2024
Check out the April 2024 Power BI update to learn about new features.

| User | Count |
|---|---|
| 111 | |
| 94 | |
| 83 | |
| 67 | |
| 59 |
| User | Count |
|---|---|
| 151 | |
| 121 | |
| 104 | |
| 87 | |
| 67 |


