- Power BI forums
- Updates
- News & Announcements
- Get Help with Power BI
- Desktop
- Service
- Report Server
- Power Query
- Mobile Apps
- Developer
- DAX Commands and Tips
- Custom Visuals Development Discussion
- Health and Life Sciences
- Power BI Spanish forums
- Translated Spanish Desktop
- Power Platform Integration - Better Together!
- Power Platform Integrations (Read-only)
- Power Platform and Dynamics 365 Integrations (Read-only)
- Training and Consulting
- Instructor Led Training
- Dashboard in a Day for Women, by Women
- Galleries
- Community Connections & How-To Videos
- COVID-19 Data Stories Gallery
- Themes Gallery
- Data Stories Gallery
- R Script Showcase
- Webinars and Video Gallery
- Quick Measures Gallery
- 2021 MSBizAppsSummit Gallery
- 2020 MSBizAppsSummit Gallery
- 2019 MSBizAppsSummit Gallery
- Events
- Ideas
- Custom Visuals Ideas
- Issues
- Issues
- Events
- Upcoming Events
- Community Blog
- Power BI Community Blog
- Custom Visuals Community Blog
- Community Support
- Community Accounts & Registration
- Using the Community
- Community Feedback
Register now to learn Fabric in free live sessions led by the best Microsoft experts. From Apr 16 to May 9, in English and Spanish.
- Power BI forums
- Forums
- Get Help with Power BI
- Desktop
- Re: cumulative total not summing up correctly
- Subscribe to RSS Feed
- Mark Topic as New
- Mark Topic as Read
- Float this Topic for Current User
- Bookmark
- Subscribe
- Printer Friendly Page
- Mark as New
- Bookmark
- Subscribe
- Mute
- Subscribe to RSS Feed
- Permalink
- Report Inappropriate Content
cumulative total not summing up correctly
Hello,
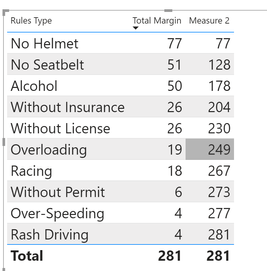
I have written a measure for cumulative total, but it is not working properly for instance where the values are same for different entity.
Below is the snapshot. I have also shared PBIX file in below link(We transfer link).
Solved! Go to Solution.
- Mark as New
- Bookmark
- Subscribe
- Mute
- Subscribe to RSS Feed
- Permalink
- Report Inappropriate Content
Hi @Anonymous ,
Normally I would take a lot more time to explain what I did but I am in a real hurry so here is the solution:
Measure 2 =
VAR _curRuleType = SELECTEDVALUE(Data[Rules Type])
VAR _filter = ALLEXCEPT(Data, Data[City], Data[Offence Count])
VAR _summaryTable = SUMMARIZE(_filter, [Rules Type], "TMargin", [Total Margin])
VAR _rankedTable = ADDCOLUMNS(_summaryTable, "Ranked",
    VAR curRuleType = [Rules Type]
    RETURN
        RANKX(_summaryTable,
            RANKX(_summaryTable, [TMargin], , DESC, Skip) +
            DIVIDE(RANKX(_summaryTable, [Rules Type], , ASC, Skip), COUNTROWS(_summaryTable) + 1),
        ,DESC,Skip)
        )
VAR _curRank = MAXX(FILTER(_rankedTable, [Rules Type] = _curRuleType), [Ranked])
RETURN
SUMX(FILTER(_rankedTable, [Ranked] >= _curRank), [TMargin])
Resulting in the following in your PBIX:
If you have any questions, please don't hesitate to ask and I will return tomorrow 🙂
Kind regards
Djerro123
-------------------------------
If this answered your question, please mark it as the Solution. This also helps others to find what they are looking for.
Keep those thumbs up coming! 🙂
Did I answer your question? Mark my post as a solution!
Proud to be a Super User!
- Mark as New
- Bookmark
- Subscribe
- Mute
- Subscribe to RSS Feed
- Permalink
- Report Inappropriate Content
Wow..!! thats a big caluclation for small looking task.
Is there any other way to simplyfy the calculation/Measure?
Helpful resources

Microsoft Fabric Learn Together
Covering the world! 9:00-10:30 AM Sydney, 4:00-5:30 PM CET (Paris/Berlin), 7:00-8:30 PM Mexico City

Power BI Monthly Update - April 2024
Check out the April 2024 Power BI update to learn about new features.

| User | Count |
|---|---|
| 109 | |
| 99 | |
| 77 | |
| 66 | |
| 54 |
| User | Count |
|---|---|
| 144 | |
| 104 | |
| 102 | |
| 87 | |
| 64 |


