- Power BI forums
- Updates
- News & Announcements
- Get Help with Power BI
- Desktop
- Service
- Report Server
- Power Query
- Mobile Apps
- Developer
- DAX Commands and Tips
- Custom Visuals Development Discussion
- Health and Life Sciences
- Power BI Spanish forums
- Translated Spanish Desktop
- Power Platform Integration - Better Together!
- Power Platform Integrations (Read-only)
- Power Platform and Dynamics 365 Integrations (Read-only)
- Training and Consulting
- Instructor Led Training
- Dashboard in a Day for Women, by Women
- Galleries
- Community Connections & How-To Videos
- COVID-19 Data Stories Gallery
- Themes Gallery
- Data Stories Gallery
- R Script Showcase
- Webinars and Video Gallery
- Quick Measures Gallery
- 2021 MSBizAppsSummit Gallery
- 2020 MSBizAppsSummit Gallery
- 2019 MSBizAppsSummit Gallery
- Events
- Ideas
- Custom Visuals Ideas
- Issues
- Issues
- Events
- Upcoming Events
- Community Blog
- Power BI Community Blog
- Custom Visuals Community Blog
- Community Support
- Community Accounts & Registration
- Using the Community
- Community Feedback
Register now to learn Fabric in free live sessions led by the best Microsoft experts. From Apr 16 to May 9, in English and Spanish.
- Power BI forums
- Forums
- Get Help with Power BI
- Desktop
- cumulative target line
- Subscribe to RSS Feed
- Mark Topic as New
- Mark Topic as Read
- Float this Topic for Current User
- Bookmark
- Subscribe
- Printer Friendly Page
- Mark as New
- Bookmark
- Subscribe
- Mute
- Subscribe to RSS Feed
- Permalink
- Report Inappropriate Content
cumulative target line
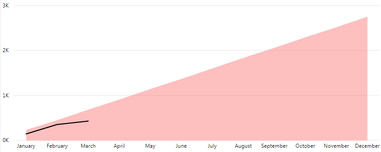
We have a metric for employees to complete 5 of a specific report type every year. I need to create a line for target number of reports throughout the year, but need it to be cumulative, so that we can compare if our rate is on track with target. Something like the picture below. The target line to be dynamic, so that we have new employees start, or employees leave, the target number will adjust accordingly, and we want to be able to filter by manager and have that target move, too. How can I do this?
I have the following tables
Employee Table
Employee ID Manager ID
AAA 111
BBB 222
Report Table
Report Number Employee ID Date Closed
001 AAA 1/2/19
002 BBB 1/9/19
and a date dimension table.
The Employee table is linked to the Report table by the Employee ID, and the Report table is linked to the Date Dimension table by the Date Closed.
What I've tried to far is to make a calculated measure in the employee table to count all full time employees (filtering out part time, etc). Then I was going to create a new column on the date dimension table to calculate the number of reports needed per day of the year (rate='employee'[# full time]*5/365). Then create a measure on the date table to calculate the cumulative year to date of that target rate to get a straight increasing line on the chart. But when I try to do this instead of getting a constant number on each row of the date table, it's giving me much smaller numbers that aren't constant, and are blank on weekend days. Like below.
Date Rate='employee'[# full time]*5/365
1/1 /19
1/2 /19 0.07
1/3 /19 0.05
1/4/19 0.03
1/5/19
1/6/19
1/7/19 0.08
1/8/19 0.03
- Mark as New
- Bookmark
- Subscribe
- Mute
- Subscribe to RSS Feed
- Permalink
- Report Inappropriate Content
Hi @toniacheung ,
You need to follow the steps below:
- Create a day number column on the Dim date table:
DAY of year =
DATEDIFF ( DATE ( YEAR ( DateDim[Date] ); 1; 1 ); DateDim[Date]; DAY ) + 1
- Add the following measure to your model:
Cumulative Target =
CALCULATE (
    SUMX ( DateDim; 5 / 365 )
        * MAX ( DateDim[DAY of year] )
        * DISTINCTCOUNT ( Employe[Employee ID] )
)
Be aware that this model needs to have the date on your x-axis.
I'm making the distinct count of the employee ID however in your description you refer that you need this to be dynamic probably you need to make some adjustment on the distinct count to make it also interact with the dates.
Regards,
MFelix
Regards
Miguel Félix
Did I answer your question? Mark my post as a solution!
Proud to be a Super User!
Check out my blog: Power BI em Português- Mark as New
- Bookmark
- Subscribe
- Mute
- Subscribe to RSS Feed
- Permalink
- Report Inappropriate Content
I was able to get most of what I want. I created a calculated column in the Employees table (
#Employees=DISTINCTCOUNT([Employee ID]).
Then I set up a calculated column in the DateDim table to get the daily target rate
Rate=MAX('Employees'[#Employees])*5/365. This gets me a column on the date dim table that has a constant value. Then I have the calculated measure Goal YTD=TOTALYTD(SUM('DateDim'[Rate]), 'DateDim'[Date]).
But when I filter by employee or their manager, the calculated #Employees column changes accordingly, but the calculated Rate column (which uses the #Employees in its calculation) doesn't change. How do I get the rate column to update based the filtered #Employees?
- Mark as New
- Bookmark
- Subscribe
- Mute
- Subscribe to RSS Feed
- Permalink
- Report Inappropriate Content
#Employees should be a measure, not a calculated column. Calculated columns are only re-calculated on data refresh. Measures are re-evaluated every time they are used.
- Mark as New
- Bookmark
- Subscribe
- Mute
- Subscribe to RSS Feed
- Permalink
- Report Inappropriate Content
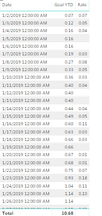
Okay. When I do the # employees as a measure, my calucation for the Rate column (Rate=MAX('Employees'[#employees calc])*5/365) breaks and I get a message saying that it can't be used in this expression. If I take out the MAX function, instead of having a constant rate for each day, Power BI is dividing what should be the total for 1 day (~7) over 365 days, and the value is not constant for every day (screenshot below). If I take the "/365" out of that formula, it's still giving me inconsistent numbers throughout that column. And it's still not affected by filtering by employee.
- Mark as New
- Bookmark
- Subscribe
- Mute
- Subscribe to RSS Feed
- Permalink
- Report Inappropriate Content
Hi @toniacheung ,
Did you try to use my measure as I posted before? On the tests I did the cumulative when ok.
Regards,
MFelix
Regards
Miguel Félix
Did I answer your question? Mark my post as a solution!
Proud to be a Super User!
Check out my blog: Power BI em Português- Mark as New
- Bookmark
- Subscribe
- Mute
- Subscribe to RSS Feed
- Permalink
- Report Inappropriate Content
I did try that cumulative formula. It's also giving me variable small numbers for each day, with some rows blank. And the numbers don't make sense for the data it's supposed be calculating.
- Mark as New
- Bookmark
- Subscribe
- Mute
- Subscribe to RSS Feed
- Permalink
- Report Inappropriate Content
You refer you have 5 reports per year making this a daily measure and as you refer 5/365 = 0,013.
In my opinion this is not the best way to show the target for this type of information.
Considering only 1 person the target for the full year is 5 doesn't matter of he is on January 1 of December 31st because making the split of reporting troughout the year seems odd to me.
Can you elaborate more on what you want to compare and follow up?
Regards,
MFelix
Regards
Miguel Félix
Did I answer your question? Mark my post as a solution!
Proud to be a Super User!
Check out my blog: Power BI em PortuguêsHelpful resources

Microsoft Fabric Learn Together
Covering the world! 9:00-10:30 AM Sydney, 4:00-5:30 PM CET (Paris/Berlin), 7:00-8:30 PM Mexico City

Power BI Monthly Update - April 2024
Check out the April 2024 Power BI update to learn about new features.

| User | Count |
|---|---|
| 108 | |
| 100 | |
| 78 | |
| 64 | |
| 58 |
| User | Count |
|---|---|
| 148 | |
| 111 | |
| 94 | |
| 84 | |
| 67 |


