- Power BI forums
- Updates
- News & Announcements
- Get Help with Power BI
- Desktop
- Service
- Report Server
- Power Query
- Mobile Apps
- Developer
- DAX Commands and Tips
- Custom Visuals Development Discussion
- Health and Life Sciences
- Power BI Spanish forums
- Translated Spanish Desktop
- Power Platform Integration - Better Together!
- Power Platform Integrations (Read-only)
- Power Platform and Dynamics 365 Integrations (Read-only)
- Training and Consulting
- Instructor Led Training
- Dashboard in a Day for Women, by Women
- Galleries
- Community Connections & How-To Videos
- COVID-19 Data Stories Gallery
- Themes Gallery
- Data Stories Gallery
- R Script Showcase
- Webinars and Video Gallery
- Quick Measures Gallery
- 2021 MSBizAppsSummit Gallery
- 2020 MSBizAppsSummit Gallery
- 2019 MSBizAppsSummit Gallery
- Events
- Ideas
- Custom Visuals Ideas
- Issues
- Issues
- Events
- Upcoming Events
- Community Blog
- Power BI Community Blog
- Custom Visuals Community Blog
- Community Support
- Community Accounts & Registration
- Using the Community
- Community Feedback
Register now to learn Fabric in free live sessions led by the best Microsoft experts. From Apr 16 to May 9, in English and Spanish.
- Power BI forums
- Forums
- Get Help with Power BI
- Desktop
- Re: compare specific last year month values to cur...
- Subscribe to RSS Feed
- Mark Topic as New
- Mark Topic as Read
- Float this Topic for Current User
- Bookmark
- Subscribe
- Printer Friendly Page
- Mark as New
- Bookmark
- Subscribe
- Mute
- Subscribe to RSS Feed
- Permalink
- Report Inappropriate Content
compare specific last year month values to current year months
Hello,
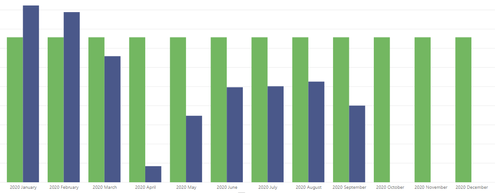
I have a requirement to compare the count of tickets this year month by month to the count of tickets in December 2019,
so the final result looks like
and the value of December 2019 to be affected by filters like Country, city,... as if the user needs to compare the number of tickets in the same city in December 2019 to current month for example, anyhelp?
Solved! Go to Solution.
- Mark as New
- Bookmark
- Subscribe
- Mute
- Subscribe to RSS Feed
- Permalink
- Report Inappropriate Content
@Anonymous Yes it is possible to achive. Follow below steps
1. Create a measure to sum Dec'19 total
Dec'19 = CALCULATE(SUM(P1&P2),'Calendar'[Year]=2019,month('Calendar'[Date])=12)
Did I answer your question? Mark my post as a solution!
Appreciate your Kudos
Proud to be a Super User!
Follow me on linkedin
- Mark as New
- Bookmark
- Subscribe
- Mute
- Subscribe to RSS Feed
- Permalink
- Report Inappropriate Content
thanks for your reply, I've done your steps and when I put a filter on the graph to show only months in 2020 the dec'19 measure disappear and it make sense as the date filter applied on the measure itself point to month in 2019 not 2020
- Mark as New
- Bookmark
- Subscribe
- Mute
- Subscribe to RSS Feed
- Permalink
- Report Inappropriate Content
@amrashrafyw I'm not sure why it doesn't work. Take a look at the next time. If you're still having trouble, please share your details and then it will help you more.
Did I answer your question? Mark my post as a solution!
Appreciate your Kudos
Proud to be a Super User!
Follow me on linkedin
- Mark as New
- Bookmark
- Subscribe
- Mute
- Subscribe to RSS Feed
- Permalink
- Report Inappropriate Content
I've tried it again but added ,ALL('date'[Start of Month])) to be like:
- Mark as New
- Bookmark
- Subscribe
- Mute
- Subscribe to RSS Feed
- Permalink
- Report Inappropriate Content
@Anonymous , With a date table
MTD Sales = CALCULATE(SUM(Sales[Sales Amount]),DATESMTD('Date'[Date]))
last year MTD Sales = CALCULATE(SUM(Sales[Sales Amount]),DATESMTD(dateadd('Date'[Date],-12,MONTH)))
last year MTD (complete) Sales = CALCULATE(SUM(Sales[Sales Amount]),DATESMTD(ENDOFMONTH(dateadd('Date'[Date],-12,MONTH))))
Year behind Sales = CALCULATE(SUM(Sales[Sales Amount]),dateadd('Date'[Date],-1,Year))
To get the best of the time intelligence function. Make sure you have a date calendar and it has been marked as the date in model view. Also, join it with the date column of your fact/s. Refer :
https://radacad.com/creating-calendar-table-in-power-bi-using-dax-functions
See if my webinar on Time Intelligence can help: https://community.powerbi.com/t5/Webinars-and-Video-Gallery/PowerBI-Time-Intelligence-Calendar-WTD-YTD-LYTD-Week-Over-Week/m-p/1051626#M184
Appreciate your Kudos.
Microsoft Power BI Learning Resources, 2023 !!
Learn Power BI - Full Course with Dec-2022, with Window, Index, Offset, 100+ Topics !!
Did I answer your question? Mark my post as a solution! Appreciate your Kudos !! Proud to be a Super User! !!
- Mark as New
- Bookmark
- Subscribe
- Mute
- Subscribe to RSS Feed
- Permalink
- Report Inappropriate Content
thanks for your reply, but those measures won't help.
what is required to be implemented: I want to have a column next to each month as shown in the graph, having the count of tickets in December 2019 and change with filters except the date filter
Helpful resources

Microsoft Fabric Learn Together
Covering the world! 9:00-10:30 AM Sydney, 4:00-5:30 PM CET (Paris/Berlin), 7:00-8:30 PM Mexico City

Power BI Monthly Update - April 2024
Check out the April 2024 Power BI update to learn about new features.

| User | Count |
|---|---|
| 112 | |
| 100 | |
| 80 | |
| 64 | |
| 57 |
| User | Count |
|---|---|
| 146 | |
| 110 | |
| 93 | |
| 84 | |
| 67 |


