- Power BI forums
- Updates
- News & Announcements
- Get Help with Power BI
- Desktop
- Service
- Report Server
- Power Query
- Mobile Apps
- Developer
- DAX Commands and Tips
- Custom Visuals Development Discussion
- Health and Life Sciences
- Power BI Spanish forums
- Translated Spanish Desktop
- Power Platform Integration - Better Together!
- Power Platform Integrations (Read-only)
- Power Platform and Dynamics 365 Integrations (Read-only)
- Training and Consulting
- Instructor Led Training
- Dashboard in a Day for Women, by Women
- Galleries
- Community Connections & How-To Videos
- COVID-19 Data Stories Gallery
- Themes Gallery
- Data Stories Gallery
- R Script Showcase
- Webinars and Video Gallery
- Quick Measures Gallery
- 2021 MSBizAppsSummit Gallery
- 2020 MSBizAppsSummit Gallery
- 2019 MSBizAppsSummit Gallery
- Events
- Ideas
- Custom Visuals Ideas
- Issues
- Issues
- Events
- Upcoming Events
- Community Blog
- Power BI Community Blog
- Custom Visuals Community Blog
- Community Support
- Community Accounts & Registration
- Using the Community
- Community Feedback
Register now to learn Fabric in free live sessions led by the best Microsoft experts. From Apr 16 to May 9, in English and Spanish.
- Power BI forums
- Forums
- Get Help with Power BI
- Desktop
- calculate avarege cost
- Subscribe to RSS Feed
- Mark Topic as New
- Mark Topic as Read
- Float this Topic for Current User
- Bookmark
- Subscribe
- Printer Friendly Page
- Mark as New
- Bookmark
- Subscribe
- Mute
- Subscribe to RSS Feed
- Permalink
- Report Inappropriate Content
calculate avarege cost
Hi community,
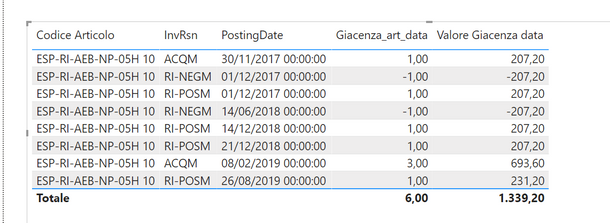
i would calculate avarege cost into onther column.
avarege cost for 2017 is 207,20 SUM (INVRSN, posting date 2017) = (207.20+207.20+207.20) / (1+1+1)
avarege cost for 2018 is 207.20 SUM (INVRSN, posting date 2017/2018) =(207.20+207.20+207.20+207.20+207.20+207.20) / (1+1+1+1+1+1)
avarege cost for 2019 is 221.60 SUM (INVRSN, posting date 2018/2019) =(207,20+207.20 +693.60)/(1+1+3)
How with dax?
thank you.
- Mark as New
- Bookmark
- Subscribe
- Mute
- Subscribe to RSS Feed
- Permalink
- Report Inappropriate Content
You should use Allexcept in this case becasue you want two year average.
You can create either measure or column, see the dax with my sample:
Measure = CALCULATE(AVERAGE('Table'[Value]),FILTER(ALL('Table'),SUMX(FILTER('Table',EARLIER('Table'[Posting date].[Year])='Table'[Posting date].[Year]||EARLIER('Table'[Posting date].[Year])='Table'[Posting date].[Year]-1),1)))Column = CALCULATE(AVERAGE('Table'[Value]),FILTER('Table','Table'[Posting date].[Year]=EARLIER('Table'[Posting date].[Year])||'Table'[Posting date].[Year]=EARLIER('Table'[Posting date].[Year])-1))
Paul Zheng
If this post helps, then please consider Accept it as the solution to help the other members find it more quickly.
- Mark as New
- Bookmark
- Subscribe
- Mute
- Subscribe to RSS Feed
- Permalink
- Report Inappropriate Content
Hi @V-pazhen-msft ,
thank you for the replay but the value on row is not correct.
i use

but the total correct for year 2017 --> 207,200 , for year 2018--> 207,200 for year 2019 --> 221,600 for year 2020 --> 221,600
- Mark as New
- Bookmark
- Subscribe
- Mute
- Subscribe to RSS Feed
- Permalink
- Report Inappropriate Content
@andreaturri27
It seems you have used show in SUM for LineAMount, where my example showed in Dont Summarize, Can you share that sample pbix so I can get a look into it for an absolute solution.
Paul
- Mark as New
- Bookmark
- Subscribe
- Mute
- Subscribe to RSS Feed
- Permalink
- Report Inappropriate Content
- Mark as New
- Bookmark
- Subscribe
- Mute
- Subscribe to RSS Feed
- Permalink
- Report Inappropriate Content
I think you use allexcept. Create a year column that would be better
refer : you need on allexcept part of it
https://community.powerbi.com/t5/Desktop/Percentage-of-subtotal/td-p/95390
https://community.powerbi.com/t5/Desktop/SUM-of-AVERAGE/td-p/197013
Microsoft Power BI Learning Resources, 2023 !!
Learn Power BI - Full Course with Dec-2022, with Window, Index, Offset, 100+ Topics !!
Did I answer your question? Mark my post as a solution! Appreciate your Kudos !! Proud to be a Super User! !!
- Mark as New
- Bookmark
- Subscribe
- Mute
- Subscribe to RSS Feed
- Permalink
- Report Inappropriate Content
Helpful resources

Microsoft Fabric Learn Together
Covering the world! 9:00-10:30 AM Sydney, 4:00-5:30 PM CET (Paris/Berlin), 7:00-8:30 PM Mexico City

Power BI Monthly Update - April 2024
Check out the April 2024 Power BI update to learn about new features.

| User | Count |
|---|---|
| 109 | |
| 98 | |
| 80 | |
| 64 | |
| 57 |
| User | Count |
|---|---|
| 145 | |
| 110 | |
| 91 | |
| 84 | |
| 66 |


