- Power BI forums
- Updates
- News & Announcements
- Get Help with Power BI
- Desktop
- Service
- Report Server
- Power Query
- Mobile Apps
- Developer
- DAX Commands and Tips
- Custom Visuals Development Discussion
- Health and Life Sciences
- Power BI Spanish forums
- Translated Spanish Desktop
- Power Platform Integration - Better Together!
- Power Platform Integrations (Read-only)
- Power Platform and Dynamics 365 Integrations (Read-only)
- Training and Consulting
- Instructor Led Training
- Dashboard in a Day for Women, by Women
- Galleries
- Community Connections & How-To Videos
- COVID-19 Data Stories Gallery
- Themes Gallery
- Data Stories Gallery
- R Script Showcase
- Webinars and Video Gallery
- Quick Measures Gallery
- 2021 MSBizAppsSummit Gallery
- 2020 MSBizAppsSummit Gallery
- 2019 MSBizAppsSummit Gallery
- Events
- Ideas
- Custom Visuals Ideas
- Issues
- Issues
- Events
- Upcoming Events
- Community Blog
- Power BI Community Blog
- Custom Visuals Community Blog
- Community Support
- Community Accounts & Registration
- Using the Community
- Community Feedback
Register now to learn Fabric in free live sessions led by the best Microsoft experts. From Apr 16 to May 9, in English and Spanish.
- Power BI forums
- Forums
- Get Help with Power BI
- Desktop
- Re: Year over Year comparison per quarters
- Subscribe to RSS Feed
- Mark Topic as New
- Mark Topic as Read
- Float this Topic for Current User
- Bookmark
- Subscribe
- Printer Friendly Page
- Mark as New
- Bookmark
- Subscribe
- Mute
- Subscribe to RSS Feed
- Permalink
- Report Inappropriate Content
Year over Year comparison per quarters
Hi all,
Let's hope someone could help me. I'll try to explain in detail my problem.
I'm creating a report about started projects in the company using several fields. Where I'm having problems is in the Year over Year. For example when I create report for 3rd quarter, my YOY compare 2019 Q3 with 2020 Q3. And what I would like to get is 2019 Q1+Q2+Q3 Vs 2020 Q1+Q2+Q3.
This how I created YOY:
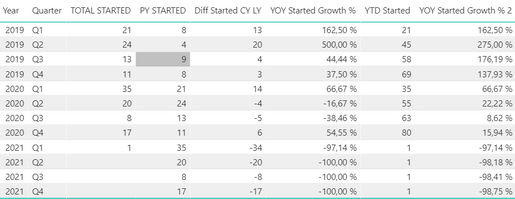
When representing values in the table, I get:
YOY started growth % = (13-8)/13 but what I would like to get is ((21+24+13) - (35+20+8)) / (35+20+8). And I'm not able to create this formula for YOY. This formula should be able to work in all quarters. I mean in Q2 should compare 2019 Q1+2019 Q2 Vs 2020 Q1+Q2.
I have been able to make it right with YTD but not with YOY. For information this how I have been able to create YTD.
Thanks for your help.
Thank you for your help.
Solved! Go to Solution.
- Mark as New
- Bookmark
- Subscribe
- Mute
- Subscribe to RSS Feed
- Permalink
- Report Inappropriate Content
Hi @parry2k
I think I have solved. I have created the following measures.
And I get the table I want:
Thanks!
- Mark as New
- Bookmark
- Subscribe
- Mute
- Subscribe to RSS Feed
- Permalink
- Report Inappropriate Content
@rubenpezu you should use DATESYTD to make it work
This Year = CALCULATE ( [Total Measure], DATESYTD ( DateTable[Date] ) )

Prev Year = CALCULATE ( [This Year], PREVIOUSYEAR ( DateTable[Date] ) )
and you can use these measure to calculate variance and % etc.
Check my latest blog post Year-2020, Pandemic, Power BI and Beyond to get a summary of my favourite Power BI feature releases in 2020
I would ❤ Kudos if my solution helped. 👉 If you can spend time posting the question, you can also make efforts to give Kudos to whoever helped to solve your problem. It is a token of appreciation!
⚡Visit us at https://perytus.com, your one-stop-shop for Power BI-related projects/training/consultancy.⚡
Subscribe to the @PowerBIHowTo YT channel for an upcoming video on List and Record functions in Power Query!!
Learn Power BI and Fabric - subscribe to our YT channel - Click here: @PowerBIHowTo
If my solution proved useful, I'd be delighted to receive Kudos. When you put effort into asking a question, it's equally thoughtful to acknowledge and give Kudos to the individual who helped you solve the problem. It's a small gesture that shows appreciation and encouragement! ❤
Did I answer your question? Mark my post as a solution. Proud to be a Super User! Appreciate your Kudos 🙂
Feel free to email me with any of your BI needs.
- Mark as New
- Bookmark
- Subscribe
- Mute
- Subscribe to RSS Feed
- Permalink
- Report Inappropriate Content
Thanks a lot @parry2k.
Something is still not working. I think the formula is not stoping in the current year to calculate the YOY. This is the formula YOY according your comments.
An this is the table I get.
And this what I want to get:
Your forumula it is working for Q4 but not for Q3, Q2 and Q1. I hope my explanation is clear.
- Mark as New
- Bookmark
- Subscribe
- Mute
- Subscribe to RSS Feed
- Permalink
- Report Inappropriate Content
Hi @parry2k
I think I have solved. I have created the following measures.
And I get the table I want:
Thanks!
Helpful resources

Microsoft Fabric Learn Together
Covering the world! 9:00-10:30 AM Sydney, 4:00-5:30 PM CET (Paris/Berlin), 7:00-8:30 PM Mexico City

Power BI Monthly Update - April 2024
Check out the April 2024 Power BI update to learn about new features.

| User | Count |
|---|---|
| 109 | |
| 98 | |
| 77 | |
| 66 | |
| 54 |
| User | Count |
|---|---|
| 144 | |
| 104 | |
| 101 | |
| 86 | |
| 64 |


