- Power BI forums
- Updates
- News & Announcements
- Get Help with Power BI
- Desktop
- Service
- Report Server
- Power Query
- Mobile Apps
- Developer
- DAX Commands and Tips
- Custom Visuals Development Discussion
- Health and Life Sciences
- Power BI Spanish forums
- Translated Spanish Desktop
- Power Platform Integration - Better Together!
- Power Platform Integrations (Read-only)
- Power Platform and Dynamics 365 Integrations (Read-only)
- Training and Consulting
- Instructor Led Training
- Dashboard in a Day for Women, by Women
- Galleries
- Community Connections & How-To Videos
- COVID-19 Data Stories Gallery
- Themes Gallery
- Data Stories Gallery
- R Script Showcase
- Webinars and Video Gallery
- Quick Measures Gallery
- 2021 MSBizAppsSummit Gallery
- 2020 MSBizAppsSummit Gallery
- 2019 MSBizAppsSummit Gallery
- Events
- Ideas
- Custom Visuals Ideas
- Issues
- Issues
- Events
- Upcoming Events
- Community Blog
- Power BI Community Blog
- Custom Visuals Community Blog
- Community Support
- Community Accounts & Registration
- Using the Community
- Community Feedback
Register now to learn Fabric in free live sessions led by the best Microsoft experts. From Apr 16 to May 9, in English and Spanish.
- Power BI forums
- Forums
- Get Help with Power BI
- Desktop
- Re: YTD line chart to be stopped at today's date
- Subscribe to RSS Feed
- Mark Topic as New
- Mark Topic as Read
- Float this Topic for Current User
- Bookmark
- Subscribe
- Printer Friendly Page
- Mark as New
- Bookmark
- Subscribe
- Mute
- Subscribe to RSS Feed
- Permalink
- Report Inappropriate Content
YTD line chart to be stopped at today's date
Hi Everyone,
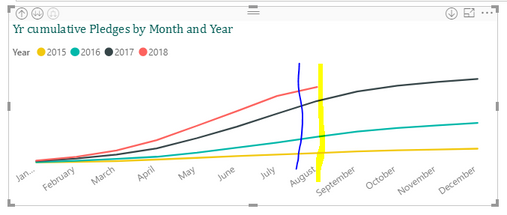
I would appreaciate if anyone can help me with building a line chart for YTD data but the line to be intercepted (stopped) at today's date (or lattest date in the data). Let me kindly explain further: when I built the visualization, the chart shows me the line till the end of August, despite we are in the middle in the month, I want the line to end at my blue drawing, not at the yellow as it does.

I have used this calendar table:
Date Table = ADDCOLUMNS(CALENDAR (DATE(2000,1,1), TODAY()))
And this formula:
Yr cumulative data =
IF(ISFILTERED('Date Table'[Date]),
ERROR("Time intelligence quick measures can only be grouped or filtered by the Power BI-provided date hierarchy or primary date column."),TOTALYTD(SUM('UK List'[GrossAmount]),'Date Table'[Date]))
Even when I tried the monthly revenue line chart, with the following formula is gives the same feature, by :
YTD cummulative =
VAR RetVal = TOTALYTD(SUM('UK List'[GrossAmount]),'Date KPI'[Date].[Date])
RETURN
IF(MAX('Date Table'[Date])<=TODAY(),RetVal)
I would be very grateful if you can help me find this solution, as it will help me to represent the real picture of the month.
Thank you so much,
All the best,
Nervida
- Mark as New
- Bookmark
- Subscribe
- Mute
- Subscribe to RSS Feed
- Permalink
- Report Inappropriate Content
You can use the "Filter on this Visual" section to drive the results you want. Simily apply the filter "Is Not Blank" to your metric, and you should see the results you want.
- Mark as New
- Bookmark
- Subscribe
- Mute
- Subscribe to RSS Feed
- Permalink
- Report Inappropriate Content
Hi @nervida
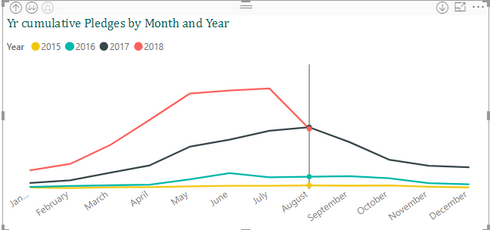
You may try to make the date hierarchy as below picture.
Regards,
Cherie
If this post helps, then please consider Accept it as the solution to help the other members find it more quickly.
- Mark as New
- Bookmark
- Subscribe
- Mute
- Subscribe to RSS Feed
- Permalink
- Report Inappropriate Content
Hi Cherie,
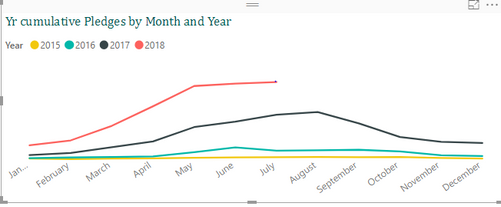
Thank you so much for your response. When I chose your given options, it stops exactly to the today's date, but it gives me in the axis the daily number and it is a very long table so I need to scroll into the graph to see all the yearly picture. Do you know any way of formating the axis so that only the months are shown:
Thank you so much,
Nervida
- Mark as New
- Bookmark
- Subscribe
- Mute
- Subscribe to RSS Feed
- Permalink
- Report Inappropriate Content
Hi @nervida
You may try to use date as Axis.
Regards,
Cherie
If this post helps, then please consider Accept it as the solution to help the other members find it more quickly.
- Mark as New
- Bookmark
- Subscribe
- Mute
- Subscribe to RSS Feed
- Permalink
- Report Inappropriate Content
YTD cummulative =
VAR RetVal = TOTALYTD(SUM('UK List'[GrossAmount]),'Date KPI'[Date].[Date])
RETURN
IF(MAX('Date Table'[Date])<DATE(YEAR(TODAY()),MONTH(TODAY(),1)),RetVal)
- Mark as New
- Bookmark
- Subscribe
- Mute
- Subscribe to RSS Feed
- Permalink
- Report Inappropriate Content
Hi Seward,
Thank you so much for your response, however the formula that you gave it to me seems to cut the August totally. It ends up until July. I want to it to shows me also the August data up to today's date.
All the best,
Nervida
- Mark as New
- Bookmark
- Subscribe
- Mute
- Subscribe to RSS Feed
- Permalink
- Report Inappropriate Content
So rather than today you need to use something like MAX of the date the measure your plotting has data rather than TODAY.
- Mark as New
- Bookmark
- Subscribe
- Mute
- Subscribe to RSS Feed
- Permalink
- Report Inappropriate Content
Hi Seward,
Dont worry at all, indeed I need to thank you for your support.
I checked the data and there are today's data value in it. Even when I put the week as axis it gives the straight line for all that week. May be I am missing something on visualization? Does your data end exactly to the last date given?
Thank you again,
Have a nice day,
Nervida
Helpful resources

Microsoft Fabric Learn Together
Covering the world! 9:00-10:30 AM Sydney, 4:00-5:30 PM CET (Paris/Berlin), 7:00-8:30 PM Mexico City

Power BI Monthly Update - April 2024
Check out the April 2024 Power BI update to learn about new features.

| User | Count |
|---|---|
| 110 | |
| 97 | |
| 78 | |
| 63 | |
| 55 |
| User | Count |
|---|---|
| 143 | |
| 109 | |
| 89 | |
| 84 | |
| 66 |


