cancel
Showing results for 
Search instead for 
Did you mean: 

Register now to learn Fabric in free live sessions led by the best Microsoft experts. From Apr 16 to May 9, in English and Spanish.

Reply
Anonymous
Not applicable

Work Breakdown Structure in Table Form

Hi There,


I have data for projects and project tasks at varying work breakdown levels.

e.g. One project may only have 2 levels Task 1 -> Task 1.1, Task 1.2, etc.
while another project has many more, Task 1 -> Task 1.1 -> Task 1.1.1 -> Task 1.1.1.1, Task 1.1.1.2, etc.

At the moment I have a table which has the following data:

- Project: What project it comes from

- Name: Name of Task
- WBS ID: e.g. 1, 1.1, 1.1.2, etc.

- Parent WBS ID: e.g. If I have a row for Task 1.1.1 the Parent would be Task 1.1

- WBS Level: Task 1 -> Level 1, Task 1.1 -> Level 2, etc.

- and various financial values at each level which are already aggregated depending on the equivalent values of child tasks.


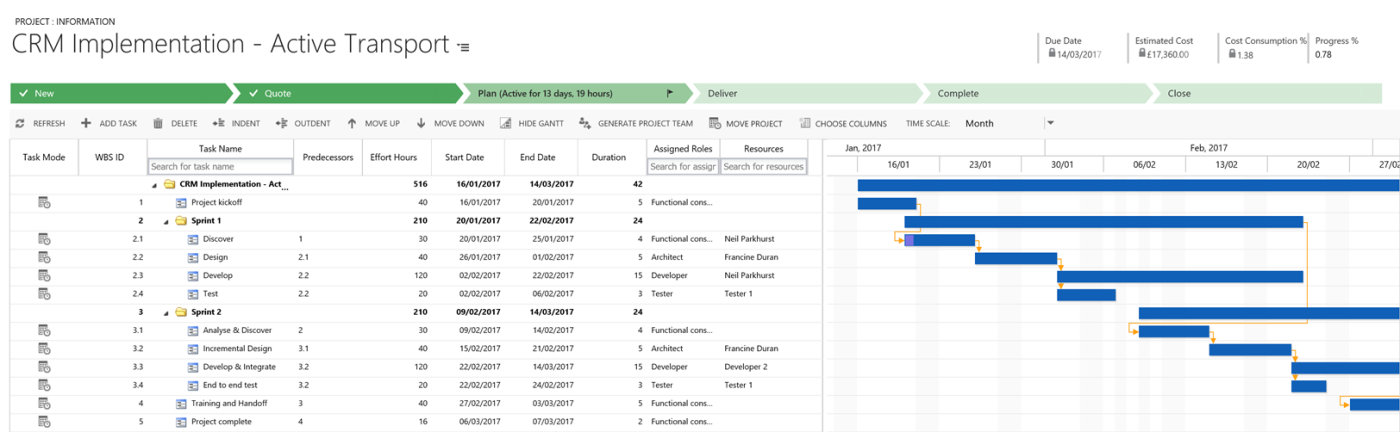
My question is, is there a way within Power BI to convert data in this form to a table similar to the table below (ignore the Gantt chart, I just want the table to the left):


1 ACCEPTED SOLUTION
Anonymous
Not applicable
2 REPLIES 2
Anonymous
Not applicable

Stachu
Community Champion
Community Champion

you will need to use PATH
https://msdn.microsoft.com/en-us/query-bi/dax/understanding-functions-for-parent-child-hierarchies-i...

https://msdn.microsoft.com/en-us/query-bi/dax/path-function-dax


Did I answer your question? Mark my post as a solution!
Thank you for the kudos 🙂

Helpful resources

Announcements
Microsoft Fabric Learn Together

Microsoft Fabric Learn Together

Covering the world! 9:00-10:30 AM Sydney, 4:00-5:30 PM CET (Paris/Berlin), 7:00-8:30 PM Mexico City

PBI_APRIL_CAROUSEL1

Power BI Monthly Update - April 2024

Check out the April 2024 Power BI update to learn about new features.

April Fabric Community Update

Fabric Community Update - April 2024

Find out what's new and trending in the Fabric Community.