- Power BI forums
- Updates
- News & Announcements
- Get Help with Power BI
- Desktop
- Service
- Report Server
- Power Query
- Mobile Apps
- Developer
- DAX Commands and Tips
- Custom Visuals Development Discussion
- Health and Life Sciences
- Power BI Spanish forums
- Translated Spanish Desktop
- Power Platform Integration - Better Together!
- Power Platform Integrations (Read-only)
- Power Platform and Dynamics 365 Integrations (Read-only)
- Training and Consulting
- Instructor Led Training
- Dashboard in a Day for Women, by Women
- Galleries
- Community Connections & How-To Videos
- COVID-19 Data Stories Gallery
- Themes Gallery
- Data Stories Gallery
- R Script Showcase
- Webinars and Video Gallery
- Quick Measures Gallery
- 2021 MSBizAppsSummit Gallery
- 2020 MSBizAppsSummit Gallery
- 2019 MSBizAppsSummit Gallery
- Events
- Ideas
- Custom Visuals Ideas
- Issues
- Issues
- Events
- Upcoming Events
- Community Blog
- Power BI Community Blog
- Custom Visuals Community Blog
- Community Support
- Community Accounts & Registration
- Using the Community
- Community Feedback
Register now to learn Fabric in free live sessions led by the best Microsoft experts. From Apr 16 to May 9, in English and Spanish.
- Power BI forums
- Forums
- Get Help with Power BI
- Desktop
- Re: When publishing report w/ line chart, dots app...
- Subscribe to RSS Feed
- Mark Topic as New
- Mark Topic as Read
- Float this Topic for Current User
- Bookmark
- Subscribe
- Printer Friendly Page
- Mark as New
- Bookmark
- Subscribe
- Mute
- Subscribe to RSS Feed
- Permalink
- Report Inappropriate Content
When publishing report w/ line chart, dots appear on line chart as if I have "Show Marker" enabled
I've made a a report in Power BI Desktop that includes a line chart. It looks like this:
When I publish my report to a workspace and then view it online, it looks like this instead:
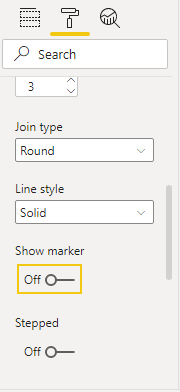
This is similar to what I would get if I enabled "Show Marker" in the Shapes dropdown, but that option is not actually enabled:
How can I make my line chart appear without pink polka dots when published (the way it already appears in the desktop client)? My Power BI desktop client is up to date. I don't know what else to check.
Solved! Go to Solution.
- Mark as New
- Bookmark
- Subscribe
- Mute
- Subscribe to RSS Feed
- Permalink
- Report Inappropriate Content
I was able to resolve this by changing the visualization from a "Line Chart" to a "Line and Stacked Column Chart," then moving both data series into the "Line Values" section (effectively making it just a Line Chart despite the change in visualization). Once I did that, republishing the report got rid of the dots.
Hat tip to this thread for pointing me toward this solution: https://community.powerbi.com/t5/Desktop/Dots-in-line-chart-when-quot-show-markers-quot-are-off/m-p/...
- Mark as New
- Bookmark
- Subscribe
- Mute
- Subscribe to RSS Feed
- Permalink
- Report Inappropriate Content
- Mark as New
- Bookmark
- Subscribe
- Mute
- Subscribe to RSS Feed
- Permalink
- Report Inappropriate Content
I am not the owner of the workspace, and there are several other reports housed there that aren't mine, so getting it deleted and recreated would be a big ask.
Is deleting and re-publishing the report worth trying?
- Mark as New
- Bookmark
- Subscribe
- Mute
- Subscribe to RSS Feed
- Permalink
- Report Inappropriate Content
Hi @A_S00 !
Please make sure [Show Marker] option is set to [Off] for both line categories. You can check this if [Customize series] option has [Show Marker] option set to [On];


You can try to publish the report in your Personal Workspace, which is specific to each user. See if the show marker behaior still exists after publishing into your Personal Workspace.
Also you can check using different browser if it keeps rendering the markers alongside line.
Regards,
Hasham
- Mark as New
- Bookmark
- Subscribe
- Mute
- Subscribe to RSS Feed
- Permalink
- Report Inappropriate Content
To test whether this action will fix it... try renaming the report and uploading it to PowerBi service
If you dont see the dots then this will be one of your potential fixes
Helpful resources

Microsoft Fabric Learn Together
Covering the world! 9:00-10:30 AM Sydney, 4:00-5:30 PM CET (Paris/Berlin), 7:00-8:30 PM Mexico City

Power BI Monthly Update - April 2024
Check out the April 2024 Power BI update to learn about new features.

| User | Count |
|---|---|
| 107 | |
| 94 | |
| 77 | |
| 63 | |
| 50 |
| User | Count |
|---|---|
| 147 | |
| 106 | |
| 104 | |
| 87 | |
| 61 |


