- Power BI forums
- Updates
- News & Announcements
- Get Help with Power BI
- Desktop
- Service
- Report Server
- Power Query
- Mobile Apps
- Developer
- DAX Commands and Tips
- Custom Visuals Development Discussion
- Health and Life Sciences
- Power BI Spanish forums
- Translated Spanish Desktop
- Power Platform Integration - Better Together!
- Power Platform Integrations (Read-only)
- Power Platform and Dynamics 365 Integrations (Read-only)
- Training and Consulting
- Instructor Led Training
- Dashboard in a Day for Women, by Women
- Galleries
- Community Connections & How-To Videos
- COVID-19 Data Stories Gallery
- Themes Gallery
- Data Stories Gallery
- R Script Showcase
- Webinars and Video Gallery
- Quick Measures Gallery
- 2021 MSBizAppsSummit Gallery
- 2020 MSBizAppsSummit Gallery
- 2019 MSBizAppsSummit Gallery
- Events
- Ideas
- Custom Visuals Ideas
- Issues
- Issues
- Events
- Upcoming Events
- Community Blog
- Power BI Community Blog
- Custom Visuals Community Blog
- Community Support
- Community Accounts & Registration
- Using the Community
- Community Feedback
Register now to learn Fabric in free live sessions led by the best Microsoft experts. From Apr 16 to May 9, in English and Spanish.
- Power BI forums
- Forums
- Get Help with Power BI
- Desktop
- Re: Visual resources exceeded error when only mino...
- Subscribe to RSS Feed
- Mark Topic as New
- Mark Topic as Read
- Float this Topic for Current User
- Bookmark
- Subscribe
- Printer Friendly Page
- Mark as New
- Bookmark
- Subscribe
- Mute
- Subscribe to RSS Feed
- Permalink
- Report Inappropriate Content
Visual resources exceeded error when only minor changes to measure and page filters are made
I will start out by saying that this issue only shows up in Service (shared capacity, not premium) but I am posting it in Desktop, because I believe that is where the issue lies. Even though the visual shows up fine in desktop, after loading for just a few seconds.
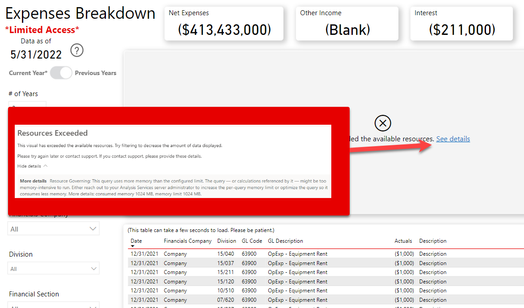
I have a table that is getting a "resources exceeded" error once uploaded to the Service on the Expenses Breakdown page (shared capacity not premium, so there is no way for me to increase the per-query memory limit as far as I am aware).
The thing that has me scratching my head is that an almost identical page (Revenue Breakdown) is rendering just fine. The measure and page filter have just a minor tweak from the one that is working to the one that is not working (marked in orange boxes in the pictures that have the measures).
My data set is rather large, it has data going back to 2014. If I reduce the data to go back only to 2020 I do not have this issue. I would like to be able to keep all of the data unless a solution is not found. I just do not understand why the Revenue Breakdown page and measure work, and the Expenses Breakdown page and measure don't work. Well, I will also mention that the Expense Breakdown measure works in the table, but not the matrix.
Measures:
Gross Revenue Breakdown - Year = IF(SELECTEDVALUE('Year Budget Values'[Year]) = "Budget - Latest Year"
, CALCULATE([Budget],AcctDesc[Financial Acct Type] = "Rev",FILTER('Budget Table', 'Budget Table'[Year] = MAX('Month Year Values'[Year])))
, CALCULATE([Actuals],AcctDesc[Financial Acct Type] = "Rev",FILTER('GL Table', YEAR('GL Table'[GLDate]) <= SELECTEDVALUE('Month Year Values'[Year]) && YEAR('GL Table'[GLDate]) >= SELECTEDVALUE('Month Year Values'[Year]) - ([Rolling Years Value] - 1)), USERELATIONSHIP('Year Budget Values'[Year],'Date'[Year - Text])))
Net Expense OpExp Breakdown - Year = IF(SELECTEDVALUE('Year Budget Values'[Year]) = "Budget - Latest Year"
, CALCULATE([Budget],AcctDesc[Financial Acct Type] = "Equipment & Supplies",FILTER('Budget Table','Budget Table'[Year] = MAX('Month Year Values'[Year])))
, CALCULATE([Actuals],AcctDesc[Financial Acct Type] = "Equipment & Supplies",FILTER('GL Table', YEAR('GL Table'[GLDate]) <= SELECTEDVALUE('Month Year Values'[Year]) && YEAR('GL Table'[GLDate]) >= SELECTEDVALUE('Month Year Values'[Year]) - ([Rolling Years Value] - 1)), USERELATIONSHIP('Year Budget Values'[Year],'Date'[Year - Text])))Budget = CALCULATE(-SUM('Budget Table'[TRANSACTIONCURRENCYAMOUNT]), 'Budget Table'[Exclude 64000] = 1)Actuals = CALCULATE(-SUM('GL Table'[TRANSACTIONCURRENCYAMOUNT]), 'GL Table'[Exclude 64000] = 1)
Expenses Breakdown page error in service:
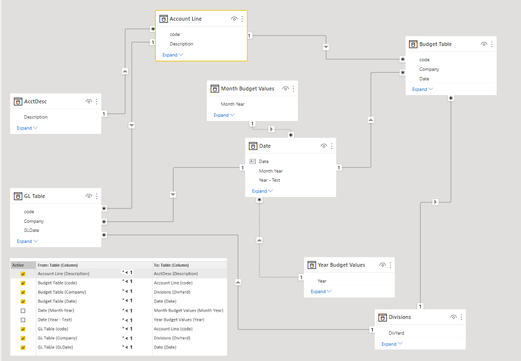
Relationships in report:
Revenue Breakdown page and measure (colored boxes correspond to the columns/values that go together - orange boxes are what are changed in the Expenses Breakdown page and measure):
Expenses Breakdown page and measure (colored boxes correspond to the columns/values that go together - orange boxes are what were changed from the Revenue Breakdown page and measure):
Solved! Go to Solution.
- Mark as New
- Bookmark
- Subscribe
- Mute
- Subscribe to RSS Feed
- Permalink
- Report Inappropriate Content
Just for anyone reading this now, I was able to fix the issue by creating a summary table in Power Query using only the columns I needed. The issue seemed to be the number of Expense records compared to the number of Revenue records. This worked like a charm!
- Mark as New
- Bookmark
- Subscribe
- Mute
- Subscribe to RSS Feed
- Permalink
- Report Inappropriate Content
Use DAX Studio to analyze the queries produced for the offending visual. Look for excessive number of records in the query plan. Think about ways to reformulate your DAX queries (if appropriate) or data model (if not)
Helpful resources

Microsoft Fabric Learn Together
Covering the world! 9:00-10:30 AM Sydney, 4:00-5:30 PM CET (Paris/Berlin), 7:00-8:30 PM Mexico City

Power BI Monthly Update - April 2024
Check out the April 2024 Power BI update to learn about new features.

| User | Count |
|---|---|
| 107 | |
| 93 | |
| 77 | |
| 65 | |
| 53 |
| User | Count |
|---|---|
| 147 | |
| 106 | |
| 104 | |
| 87 | |
| 61 |


