- Power BI forums
- Updates
- News & Announcements
- Get Help with Power BI
- Desktop
- Service
- Report Server
- Power Query
- Mobile Apps
- Developer
- DAX Commands and Tips
- Custom Visuals Development Discussion
- Health and Life Sciences
- Power BI Spanish forums
- Translated Spanish Desktop
- Power Platform Integration - Better Together!
- Power Platform Integrations (Read-only)
- Power Platform and Dynamics 365 Integrations (Read-only)
- Training and Consulting
- Instructor Led Training
- Dashboard in a Day for Women, by Women
- Galleries
- Community Connections & How-To Videos
- COVID-19 Data Stories Gallery
- Themes Gallery
- Data Stories Gallery
- R Script Showcase
- Webinars and Video Gallery
- Quick Measures Gallery
- 2021 MSBizAppsSummit Gallery
- 2020 MSBizAppsSummit Gallery
- 2019 MSBizAppsSummit Gallery
- Events
- Ideas
- Custom Visuals Ideas
- Issues
- Issues
- Events
- Upcoming Events
- Community Blog
- Power BI Community Blog
- Custom Visuals Community Blog
- Community Support
- Community Accounts & Registration
- Using the Community
- Community Feedback
Register now to learn Fabric in free live sessions led by the best Microsoft experts. From Apr 16 to May 9, in English and Spanish.
- Power BI forums
- Forums
- Get Help with Power BI
- Desktop
- Re: Visual filter to separate two different column...
- Subscribe to RSS Feed
- Mark Topic as New
- Mark Topic as Read
- Float this Topic for Current User
- Bookmark
- Subscribe
- Printer Friendly Page
- Mark as New
- Bookmark
- Subscribe
- Mute
- Subscribe to RSS Feed
- Permalink
- Report Inappropriate Content
Visual filter to separate two different columns with values
Hey guys
I have a dataset that looks something like this:
[Product] , [Customer], [Time - Month], [Sales Month], [Sales YTD].
What I want to do is to be able to filter out weather a visual should be showing monthly sales or YTD sales.
Currently, I need two seperate visuals for this, but a slicer would be so much better.
Right now I seperate the two with measures such as SUM([Sales Month]) and SUM([Sales YTD]).
But if I could have measure like: SUM([Sales Month]) + SUM([Sales YTD]) on my visual, then next to my visual would be a single select slicer that could determine weather I display Month values or YTD values.
What am I missing here?
P.S - I always get Month + YTD data from the system, so I am not looking to change the underlying data really.
I only get monthly data from previous month, so YTD DAX time measures are not really working well for me either.
Any tips would be appreciated.
Rasmus
Solved! Go to Solution.
- Mark as New
- Bookmark
- Subscribe
- Mute
- Subscribe to RSS Feed
- Permalink
- Report Inappropriate Content
Hi,
According to your sample file, i think it is the same with my original post.
Please try to create a slicer table by Enter Data:
Then try this measure:
Sum of Periodic/YTD =
SWITCH (
    TRUE,
    SELECTEDVALUE ( 'New Slicer Table'[New Slicer Value] ) = "Sum of Periodic", SUM ( 'Rasmus - Table'[Periodic] ),
    SELECTEDVALUE ( 'New Slicer Table'[New Slicer Value] ) = "Sum of YTD", SUM ( 'Rasmus - Table'[YTD] )
)
Choose this measure as a Card visual, [New Slicer Value] as a slicer.
When you select one in slicer, the result shows:
Here is the changed pbix file:
if i have solved your issue, please mark it as a solution for others to see.
Thanks!
Best Regards,
Giotto Zhi
- Mark as New
- Bookmark
- Subscribe
- Mute
- Subscribe to RSS Feed
- Permalink
- Report Inappropriate Content
Hi,
According to your description, i create a sample to test:
Create a slicer table by Enter Data first:
Then try this measure:
Measure =
SWITCH (
    TRUE,
    SELECTEDVALUE ( 'Slicer Table'[Slicer Value] ) = "_Monthly Sales", CALCULATE (
        SUM ( 'Table'[Sales] ),
        FILTER (
            'Table',
            'Table'[Year] IN FILTERS ( 'Table'[Year] )
                && 'Table'[Month] IN FILTERS ( 'Table'[Month] )
        )
    ),
    SELECTEDVALUE ( 'Slicer Table'[Slicer Value] ) = "_YTD Sales", CALCULATE (
        SUM ( 'Table'[Sales] ),
        FILTER ( ALL ( 'Table' ), 'Table'[Year] <= MAX ( 'Table'[Year] ) )
    )
)
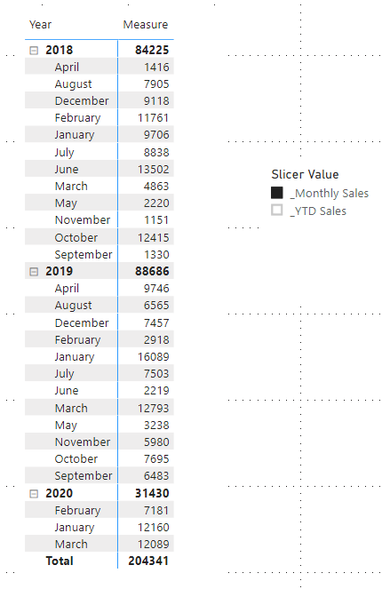
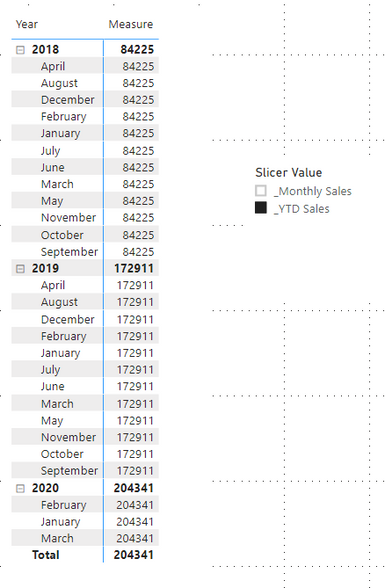
Choose [Year],[Month] and this measure as a matrix visual, [Slicer Value] as a slicer.
When you select one value in slicer, the result shows:
Here is my test pbix file:
Hope this helps.
Best Regards,
Giotto Zhi
- Mark as New
- Bookmark
- Subscribe
- Mute
- Subscribe to RSS Feed
- Permalink
- Report Inappropriate Content
Hi Giotto and thanks for showing interest in helping me out!
I guess the reason I can't use your solution is because you only have one data field called sales. I have two data fields, Periodic and YTD. I am happy to keep it that way, but want the slicer to reflect one of the two columns.
I made changes to the sample pbix. to include how my data is set up.
Maybe you can use similar logic to my sample table instead?
- Mark as New
- Bookmark
- Subscribe
- Mute
- Subscribe to RSS Feed
- Permalink
- Report Inappropriate Content
Hi,
According to your sample file, i think it is the same with my original post.
Please try to create a slicer table by Enter Data:
Then try this measure:
Sum of Periodic/YTD =
SWITCH (
    TRUE,
    SELECTEDVALUE ( 'New Slicer Table'[New Slicer Value] ) = "Sum of Periodic", SUM ( 'Rasmus - Table'[Periodic] ),
    SELECTEDVALUE ( 'New Slicer Table'[New Slicer Value] ) = "Sum of YTD", SUM ( 'Rasmus - Table'[YTD] )
)
Choose this measure as a Card visual, [New Slicer Value] as a slicer.
When you select one in slicer, the result shows:
Here is the changed pbix file:
if i have solved your issue, please mark it as a solution for others to see.
Thanks!
Best Regards,
Giotto Zhi
- Mark as New
- Bookmark
- Subscribe
- Mute
- Subscribe to RSS Feed
- Permalink
- Report Inappropriate Content
Thanks Giotto - You made my day with this solution! Very kind of you.
- Mark as New
- Bookmark
- Subscribe
- Mute
- Subscribe to RSS Feed
- Permalink
- Report Inappropriate Content
@amitchandak - Maybe you can also try with the PBIX and screenshots I attached above?
I don't think the thread you posted helps me, but with this file it should be pretty clear 🙂
- Mark as New
- Bookmark
- Subscribe
- Mute
- Subscribe to RSS Feed
- Permalink
- Report Inappropriate Content
We can create a column to subtract this month YTD from the previous month YTD. I suggest formula based the month format you have .
Assume you have formate like jan-2020
The create a date = "1-"& [Month Year], mark this has date
create new previous month column
Last date = Date(Year([Date]),Month([Date])-1, 1) //Assuming month level data
new column
Last month ytd = sumx(filter(table, table[product] = earlier(table[product])
&& table[customer] = earlier(table[customer])
&& table[date] = earlier(table[last date])),table[Sales YTD])
Microsoft Power BI Learning Resources, 2023 !!
Learn Power BI - Full Course with Dec-2022, with Window, Index, Offset, 100+ Topics !!
Did I answer your question? Mark my post as a solution! Appreciate your Kudos !! Proud to be a Super User! !!
- Mark as New
- Bookmark
- Subscribe
- Mute
- Subscribe to RSS Feed
- Permalink
- Report Inappropriate Content
Hi Amit and thanks for helping me out.
I do not see how your solution is solving the issue though, I already have two columns showing both monthly and YTD data so I already have the values figured out. What I would like is a single click to separate what to visualize.
- Mark as New
- Bookmark
- Subscribe
- Mute
- Subscribe to RSS Feed
- Permalink
- Report Inappropriate Content
Not clear, Do you want to exchange what to visualize
https://radacad.com/bookmarks-and-buttons-making-power-bi-charts-even-more-interactive
Can you explain with example
Microsoft Power BI Learning Resources, 2023 !!
Learn Power BI - Full Course with Dec-2022, with Window, Index, Offset, 100+ Topics !!
Did I answer your question? Mark my post as a solution! Appreciate your Kudos !! Proud to be a Super User! !!
- Mark as New
- Bookmark
- Subscribe
- Mute
- Subscribe to RSS Feed
- Permalink
- Report Inappropriate Content
Surely @amitchandak - I will try my best to show and explain:
Here is the format of my data table. As you see I have two columns with values: Monthly values (Periodic) and YTD values (YTD).
I would like to be able to filter if the visual should show SUM([Periodic]) or SUM([YTD]).
Currently I need two different visuals for two different measures - but if I could use one visual, a measure of both and a filter slicer to determine which of Periodic and YTD gets displayed.
More clear? 🙂
- Mark as New
- Bookmark
- Subscribe
- Mute
- Subscribe to RSS Feed
- Permalink
- Report Inappropriate Content
@Anonymous , have you cheked, if this can help : https://community.powerbi.com/t5/Desktop/Slicer-MTD-QTD-YTD-to-filter-dates-using-the-slicer/td-p/500115
Microsoft Power BI Learning Resources, 2023 !!
Learn Power BI - Full Course with Dec-2022, with Window, Index, Offset, 100+ Topics !!
Did I answer your question? Mark my post as a solution! Appreciate your Kudos !! Proud to be a Super User! !!
Helpful resources

Microsoft Fabric Learn Together
Covering the world! 9:00-10:30 AM Sydney, 4:00-5:30 PM CET (Paris/Berlin), 7:00-8:30 PM Mexico City

Power BI Monthly Update - April 2024
Check out the April 2024 Power BI update to learn about new features.

| User | Count |
|---|---|
| 109 | |
| 98 | |
| 80 | |
| 64 | |
| 57 |
| User | Count |
|---|---|
| 145 | |
| 111 | |
| 92 | |
| 84 | |
| 66 |


