- Power BI forums
- Updates
- News & Announcements
- Get Help with Power BI
- Desktop
- Service
- Report Server
- Power Query
- Mobile Apps
- Developer
- DAX Commands and Tips
- Custom Visuals Development Discussion
- Health and Life Sciences
- Power BI Spanish forums
- Translated Spanish Desktop
- Power Platform Integration - Better Together!
- Power Platform Integrations (Read-only)
- Power Platform and Dynamics 365 Integrations (Read-only)
- Training and Consulting
- Instructor Led Training
- Dashboard in a Day for Women, by Women
- Galleries
- Community Connections & How-To Videos
- COVID-19 Data Stories Gallery
- Themes Gallery
- Data Stories Gallery
- R Script Showcase
- Webinars and Video Gallery
- Quick Measures Gallery
- 2021 MSBizAppsSummit Gallery
- 2020 MSBizAppsSummit Gallery
- 2019 MSBizAppsSummit Gallery
- Events
- Ideas
- Custom Visuals Ideas
- Issues
- Issues
- Events
- Upcoming Events
- Community Blog
- Power BI Community Blog
- Custom Visuals Community Blog
- Community Support
- Community Accounts & Registration
- Using the Community
- Community Feedback
Register now to learn Fabric in free live sessions led by the best Microsoft experts. From Apr 16 to May 9, in English and Spanish.
- Power BI forums
- Forums
- Get Help with Power BI
- Desktop
- Visual Alert Gauge
- Subscribe to RSS Feed
- Mark Topic as New
- Mark Topic as Read
- Float this Topic for Current User
- Bookmark
- Subscribe
- Printer Friendly Page
- Mark as New
- Bookmark
- Subscribe
- Mute
- Subscribe to RSS Feed
- Permalink
- Report Inappropriate Content
Visual Alert Gauge
Hello all,
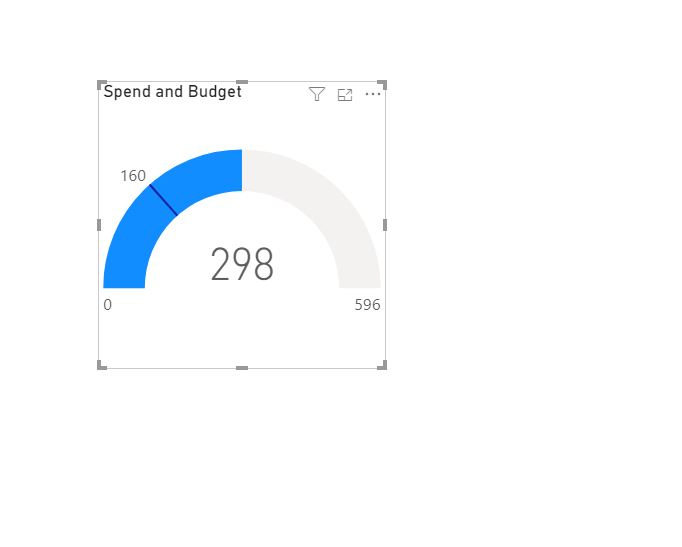
I'd like to show some kind of visual alert on the Gauge when it exceeds the limit of the budget.
Below, there is an example of it. The amount already used is 298K and the budget's limit is 160K.
I searched trough the web but couldn't find anything specific for this type of gauge.
Thanks in advance
Solved! Go to Solution.
- Mark as New
- Bookmark
- Subscribe
- Mute
- Subscribe to RSS Feed
- Permalink
- Report Inappropriate Content
Hi @EricHHA
This is a kpi visual, please see how to create this visual:
https://docs.microsoft.com/en-us/power-bi/visuals/power-bi-visualization-kpi
By default, the Gauge visual doesn't show that "!" sign.
Or we may work with some workarounds:
1. conditional formatting
https://radacad.com/sentiment-colors-for-gauge-visual-in-power-bi
Measure
color = IF(SUM('Table'[value])>SUM('Table'[goal]),1,0)

2.
Or add a card visual
Measure = IF(SUM('Table'[value])>SUM('Table'[goal]),"!"," ")
Turn off "border" for card visual.
Best Regards
Maggie
Community Support Team _ Maggie Li
If this post helps, then please consider Accept it as the solution to help the other members find it more quickly.
- Mark as New
- Bookmark
- Subscribe
- Mute
- Subscribe to RSS Feed
- Permalink
- Report Inappropriate Content
Thank you for the replies, but I still did not find any kind of "alert" within the view. As mentioned, I did put the budget on target value, but it simply added a slash on the gauge. What I really want to show is something like the image below, some kind of "!" red sign showing that the max value has been reached.
Again, thanks a lot
- Mark as New
- Bookmark
- Subscribe
- Mute
- Subscribe to RSS Feed
- Permalink
- Report Inappropriate Content
Hi @EricHHA
This is a kpi visual, please see how to create this visual:
https://docs.microsoft.com/en-us/power-bi/visuals/power-bi-visualization-kpi
By default, the Gauge visual doesn't show that "!" sign.
Or we may work with some workarounds:
1. conditional formatting
https://radacad.com/sentiment-colors-for-gauge-visual-in-power-bi
Measure
color = IF(SUM('Table'[value])>SUM('Table'[goal]),1,0)2.
Or add a card visual
Measure = IF(SUM('Table'[value])>SUM('Table'[goal]),"!"," ")Turn off "border" for card visual.
Best Regards
Maggie
Community Support Team _ Maggie Li
If this post helps, then please consider Accept it as the solution to help the other members find it more quickly.
- Mark as New
- Bookmark
- Subscribe
- Mute
- Subscribe to RSS Feed
- Permalink
- Report Inappropriate Content
Hi Maggie,
Thanks a lot for the support! Really appreciate it.
- Mark as New
- Bookmark
- Subscribe
- Mute
- Subscribe to RSS Feed
- Permalink
- Report Inappropriate Content
Hi @EricHHA
As checked, their answers all seems to be helpful.
There are some Gauge visuals you could use in Power BI.
https://visualbi.com/blogs/microsoft/powerbi/custom-visuals/5-advanced-gauge-customization-power-bi/
Also, you could also add alerts in Power BI Service so Power BI can sends notifications to you and your members when the data exceeds the limit.
https://docs.microsoft.com/en-us/power-bi/consumer/end-user-alerts
Best Regards
Maggie
Community Support Team _ Maggie Li
If this post helps, then please consider Accept it as the solution to help the other members find it more quickly.
- Mark as New
- Bookmark
- Subscribe
- Mute
- Subscribe to RSS Feed
- Permalink
- Report Inappropriate Content
if you put a budget value on the goal and spending on the value you should show
you can play with the most settings to get a better view, is that what you're looking for?
If I took the time to answer your question and I came up with a solution, please mark my post as a solution and /or give kudos freely for the effort 🙂 Thank you!
Proud to be a Super User!
- Mark as New
- Bookmark
- Subscribe
- Mute
- Subscribe to RSS Feed
- Permalink
- Report Inappropriate Content
if you put a budget value in the target and the spend in the value it should show
you can play with settings more to get a better view, is that what you looking for?
If I took the time to answer your question and I came up with a solution, please mark my post as a solution and /or give kudos freely for the effort 🙂 Thank you!
Proud to be a Super User!
- Mark as New
- Bookmark
- Subscribe
- Mute
- Subscribe to RSS Feed
- Permalink
- Report Inappropriate Content
@EricHHA , you can create one and pud that in card visual and group the with Guage visual
https://docs.microsoft.com/en-us/power-bi/visuals/power-bi-visualization-radial-gauge-charts
https://docs.microsoft.com/en-us/power-bi/desktop-grouping-visuals
Microsoft Power BI Learning Resources, 2023 !!
Learn Power BI - Full Course with Dec-2022, with Window, Index, Offset, 100+ Topics !!
Did I answer your question? Mark my post as a solution! Appreciate your Kudos !! Proud to be a Super User! !!
Helpful resources

Microsoft Fabric Learn Together
Covering the world! 9:00-10:30 AM Sydney, 4:00-5:30 PM CET (Paris/Berlin), 7:00-8:30 PM Mexico City

Power BI Monthly Update - April 2024
Check out the April 2024 Power BI update to learn about new features.

Fabric Community Update - April 2024
Find out what's new and trending in the Fabric Community.

| User | Count |
|---|---|
| 113 | |
| 100 | |
| 78 | |
| 75 | |
| 51 |
| User | Count |
|---|---|
| 144 | |
| 109 | |
| 108 | |
| 88 | |
| 61 |