- Power BI forums
- Updates
- News & Announcements
- Get Help with Power BI
- Desktop
- Service
- Report Server
- Power Query
- Mobile Apps
- Developer
- DAX Commands and Tips
- Custom Visuals Development Discussion
- Health and Life Sciences
- Power BI Spanish forums
- Translated Spanish Desktop
- Power Platform Integration - Better Together!
- Power Platform Integrations (Read-only)
- Power Platform and Dynamics 365 Integrations (Read-only)
- Training and Consulting
- Instructor Led Training
- Dashboard in a Day for Women, by Women
- Galleries
- Community Connections & How-To Videos
- COVID-19 Data Stories Gallery
- Themes Gallery
- Data Stories Gallery
- R Script Showcase
- Webinars and Video Gallery
- Quick Measures Gallery
- 2021 MSBizAppsSummit Gallery
- 2020 MSBizAppsSummit Gallery
- 2019 MSBizAppsSummit Gallery
- Events
- Ideas
- Custom Visuals Ideas
- Issues
- Issues
- Events
- Upcoming Events
- Community Blog
- Power BI Community Blog
- Custom Visuals Community Blog
- Community Support
- Community Accounts & Registration
- Using the Community
- Community Feedback
Register now to learn Fabric in free live sessions led by the best Microsoft experts. From Apr 16 to May 9, in English and Spanish.
- Power BI forums
- Forums
- Get Help with Power BI
- Desktop
- Re: Using filters in measures/ Applying to a visua...
- Subscribe to RSS Feed
- Mark Topic as New
- Mark Topic as Read
- Float this Topic for Current User
- Bookmark
- Subscribe
- Printer Friendly Page
- Mark as New
- Bookmark
- Subscribe
- Mute
- Subscribe to RSS Feed
- Permalink
- Report Inappropriate Content
Using filters in measures/ Applying to a visual
Hi
I am getting in a mess with filters again and would appreciate some guidance. I have created a simple replica of my file as my data is quite sensitive.
Essentially I have 2 key tables - Sales and Sales Transactions
The Sales table contains a list of customers with a cohort field which is taken from the Date table. A customer can only appear once in a cohort but can appear in several cohorts. The Date of Sale decides which cohorts they are in.
The Sales Transactions is a list of all sales transactions by customer by [NewOutcomeDate]. If the [NewOutcomeDate] is greater than [DateSale], it is considered a new transaction. I have created a column [New Transaction] which marks this as a 1, if New and 0 if not. I have then created a measure #NewTransactions1 which counts the SalesTransactions[transactionID] where [NewTransaction]=1
Finally, I have created a column in the Sales Table to mark if the Customer is a repeat customer - RepeatCustomer = if([#NewTransactions1]>0,1,0). This is then grouped for Repeat customer as yes or no and dropped into a pie chart against # in group which is a distinct count of 'Sales'[LinkID]. I intend to use this to filter other visuals
This part seems to work fine. However, there is an extra level of filtering I would like to add. In the Sales Transactions table there is an Outcome Level column. I need to be able to give the user the option to filter the information to only count New transactions where the outcome level is either high or low using a slicer.
I have created various measures and seem able to count the number of repeat customers based on the level filter (see filtered count for one option) but I can't get my head around how this can be translated into the pie chart. It's probably simple but this is all new to me!
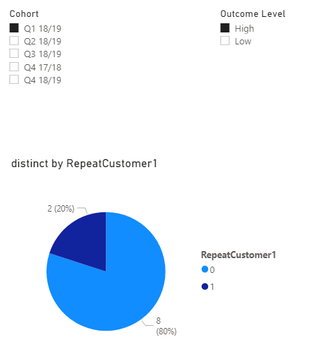
Example - For the Q1 18/19, there should be 10 Customer IDs. Without filters, 4 are repeat customers and 6 are non. If only counting new transactions with an outcome level of 'high' there should be 2 repeat customers and 8 non.
Hopefully that makes sense - any guidance would be so helpful.
Thank you!
- Mark as New
- Bookmark
- Subscribe
- Mute
- Subscribe to RSS Feed
- Permalink
- Report Inappropriate Content
Hi @WBscooby ,
Here are the steps you can follow:
1. Create calculated column.
RepeatCustomer1 =
IF([Outcome Level]="High",[RepeatHigh],[RepeatLow])
2. Create measure.
distinct = DISTINCTCOUNT('SalesTransactions'[Link ID])
3. Use the [Cohort] column and [Outcome Level] column of the SalesTransactions table as slicers. Place measure[distinct] and calculated column[RepeatCustomer1] into the Pie chart
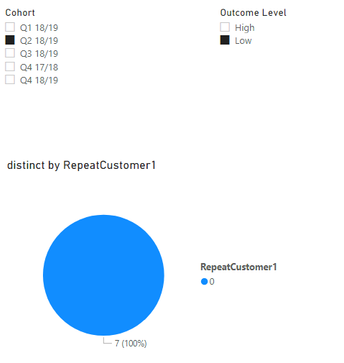
4. Result.
When Cohort is Q1 18/19 and Outcome Level is High
When Cohort is Q2 18/19 and Outcome Level is Low
You can downloaded PBIX file from here.
Best Regards,
Liu Yang
If this post helps, then please consider Accept it as the solution to help the other members find it more quickly.
- Mark as New
- Bookmark
- Subscribe
- Mute
- Subscribe to RSS Feed
- Permalink
- Report Inappropriate Content
This is definitely closer to the outcome I am trying to achieve but the logic is not quite right.
Rather than filtering the data for for only those that are high or low level,
I want to include all of the distinct LinkIDs in the cohort (Q2 = 11) and if they have a 1 in RepeatLow = 1 and if they have a 0 in RepeatLow = 0. There should always be 11 customers in the pie chart so for Q2 there should be 11 customers with 0.
I've created a table to show the data that I'm trying to put into the pie for both the RepeatLow and RepeatHigh options using Max.
I'm wondering if need to create a summarize table but hoped there was a way to do it with filtering.
Thank you so much for persisting with this!
- Mark as New
- Bookmark
- Subscribe
- Mute
- Subscribe to RSS Feed
- Permalink
- Report Inappropriate Content
Hi @WBscooby ,
Here are the steps you can follow:
1. Create measure.
Measure 2 =
var _select=SELECTEDVALUE('SalesTransactions'[Outcome Level])
return
SWITCH(
    TRUE(),
    _select="High",
    CALCULATE(DISTINCTCOUNT('SalesTransactions'[Link ID]),FILTER(ALL('SalesTransactions'),'SalesTransactions'[RepeatHigh]=MAX('SalesTransactions'[RepeatHigh])&&'SalesTransactions'[Cohort]=MAX(SalesTransactions[Cohort])&&'SalesTransactions'[Outcome Level]="High")),
    _select="Low",
    CALCULATE(DISTINCTCOUNT('SalesTransactions'[Link ID]),FILTER(ALL('SalesTransactions'),'SalesTransactions'[RepeatLow]=MAX('SalesTransactions'[RepeatLow])&&'SalesTransactions'[Cohort]=MAX(SalesTransactions[Cohort])&&'SalesTransactions'[Outcome Level]="Low")),
    BLANK()
)
2. Result.
Outcome level = High:
Outcome level = Low:
When you select Low, your Link ID has only eight totals in the table, so it will appear that when you select "Low", the number in the pie is reduced, so you can see if there is an error in which step, which causes the total to decrease.
You can downloaded PBIX file from here.
Best Regards,
Liu Yang
If this post helps, then please consider Accept it as the solution to help the other members find it more quickly.
- Mark as New
- Bookmark
- Subscribe
- Mute
- Subscribe to RSS Feed
- Permalink
- Report Inappropriate Content
This is great, thank you. I created Measure 3 which replicated your measure but removed the additional filter on outcome level. This now gives the correct results for Q1 and for all other quarters with the exception of 'Low' on Q2. There are only 11 distinct IDs for the Q2 and this works perfectly on 'High' but when I select 'Low' it counts 11 for both Repeat Customer 0 and Repeat Customer 1. I have played around with it but cannot work out why this is. There should be a distinct count of 11 LinkIDs for Repeat Customer 0.
Do you have any idea why this might be happening? Thank you and sorry for the continued questions! It is really helping my understanding.
https://1drv.ms/u/s!Ap6q8W-mvm27g-cURRhiJzcoSEwh_Q
- Mark as New
- Bookmark
- Subscribe
- Mute
- Subscribe to RSS Feed
- Permalink
- Report Inappropriate Content
Hi @WBscooby ,
Here are the steps you can follow:
1. Create calculated colum.
Related = RELATED('Sales'[RepeatCustomer (groups)])Flag =
IF(
[Related]="No",0,
IF(
[Outcome Level]="High",
IF([NewTransaction]=1,1,0),1
))Flag1 =
IF(
[Outcome Level]="High"&&[Flag]=1,
IF(
[TransactionID]=MAXX(FILTER('SalesTransactions',[Customer ID]=EARLIER([Customer ID])),[TransactionID]),1,0),
IF([Flag]=0,0,1))2. Result
You can downloaded PBIX file from here.
Best Regards,
Liu Yang
If this post helps, then please consider Accept it as the solution to help the other members find it more quickly.
- Mark as New
- Bookmark
- Subscribe
- Mute
- Subscribe to RSS Feed
- Permalink
- Report Inappropriate Content
Thank you, this is really helpful. As suggested, I have created some flags on my data using a slightly different methodology because I got a bit confused by the DAX. I now have columns to flag if they are repeat customers for both high and low level outcomes.
I'm struggling to work out how to apply them. I still have is that I want 'High' or 'Low' to be the slicer options. The selection should then filter the pie and other visuals to show if they are repeat customers. On the attached revise mock up, this shows correctly for 'High' but the numbers in the pie are reduced when selecting 'low'. There should always be 10 in the group - For high level filter I only want to count those with a high level of outcome as a repeat customer. For low, only those with a low level of outcome, but the total number of customers should remain the same.
Sorry if I'm not explaining well! I've attached a new file. Thank you
- Mark as New
- Bookmark
- Subscribe
- Mute
- Subscribe to RSS Feed
- Permalink
- Report Inappropriate Content
Hi @WBscooby ,
I put RepeatCustomer (groups) into SalesTransactions using the Related function
RepeatCustomer (groups) = RELATED('Sales'[RepeatCustomer (groups)])
Through counting, it is found that in Q1 18/19, when Outcome Level is High,If RepeatCustomer (groups)=Yes, 4, if RepeatCustomer (groups)=No, 8
Your result did not seem wrong, you say there should be two repeat customers and eight non-repeat customers, it refers to the circumstances under which
Best Regards,
Liu Yang
If this post helps, then please consider Accept it as the solution to help the other members find it more quickly.
- Mark as New
- Bookmark
- Subscribe
- Mute
- Subscribe to RSS Feed
- Permalink
- Report Inappropriate Content
Hi Liu Yang
Thank you for replying. From the Sales table, there are 10 customers in Q1 1819. Of these, 4 are repeat customers. If you filter the sales transactions to Outcome level = high in the Sales Transactions table, only 2 will qualify as repeat customers as the Outcome level = low is not counted as a repeat. As there are 10 customers in Q1 1819 that means 2 repeat, 8 non repeat. I'm unsure how to show this as I would like the user to be able to use a slicer to determine if repeat customers include high or low level outcomes. Hope that makes sense!
Thank you
Jess
Helpful resources

Microsoft Fabric Learn Together
Covering the world! 9:00-10:30 AM Sydney, 4:00-5:30 PM CET (Paris/Berlin), 7:00-8:30 PM Mexico City

Power BI Monthly Update - April 2024
Check out the April 2024 Power BI update to learn about new features.

| User | Count |
|---|---|
| 114 | |
| 100 | |
| 75 | |
| 73 | |
| 49 |
| User | Count |
|---|---|
| 145 | |
| 109 | |
| 109 | |
| 90 | |
| 64 |


