- Power BI forums
- Updates
- News & Announcements
- Get Help with Power BI
- Desktop
- Service
- Report Server
- Power Query
- Mobile Apps
- Developer
- DAX Commands and Tips
- Custom Visuals Development Discussion
- Health and Life Sciences
- Power BI Spanish forums
- Translated Spanish Desktop
- Power Platform Integration - Better Together!
- Power Platform Integrations (Read-only)
- Power Platform and Dynamics 365 Integrations (Read-only)
- Training and Consulting
- Instructor Led Training
- Dashboard in a Day for Women, by Women
- Galleries
- Community Connections & How-To Videos
- COVID-19 Data Stories Gallery
- Themes Gallery
- Data Stories Gallery
- R Script Showcase
- Webinars and Video Gallery
- Quick Measures Gallery
- 2021 MSBizAppsSummit Gallery
- 2020 MSBizAppsSummit Gallery
- 2019 MSBizAppsSummit Gallery
- Events
- Ideas
- Custom Visuals Ideas
- Issues
- Issues
- Events
- Upcoming Events
- Community Blog
- Power BI Community Blog
- Custom Visuals Community Blog
- Community Support
- Community Accounts & Registration
- Using the Community
- Community Feedback
Register now to learn Fabric in free live sessions led by the best Microsoft experts. From Apr 16 to May 9, in English and Spanish.
- Power BI forums
- Forums
- Get Help with Power BI
- Desktop
- Use parameters to create conditional columns
- Subscribe to RSS Feed
- Mark Topic as New
- Mark Topic as Read
- Float this Topic for Current User
- Bookmark
- Subscribe
- Printer Friendly Page
- Mark as New
- Bookmark
- Subscribe
- Mute
- Subscribe to RSS Feed
- Permalink
- Report Inappropriate Content
Use parameters to create conditional columns
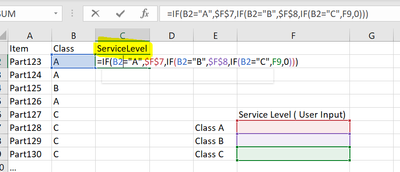
When I first created 3 Parameter. Service Level for A class I set up at 0.97, and B class at 0.95 and Class at 0.93.
Then I created a calculated coloumn call "Service Level" based on the parameter user input. (Pic 1 & 2)
But the Parameter is not working. As you can see in Pic 3, i change the parameter on the slicer, but in Pic 2 the value still stay the same...
Where did i do wrong? Help please!

Solved! Go to Solution.
- Mark as New
- Bookmark
- Subscribe
- Mute
- Subscribe to RSS Feed
- Permalink
- Report Inappropriate Content
Hey @chutli ,
that was a little trick, but try the following measure. I guess you have to adapt it to your tables:
ServiceLevel =
VAR vClassA = SELECTEDVALUE('Input_Service Level - A'[A Value], 1) -- Name of your Slicer table and column
VAR vClassB = SELECTEDVALUE('Input_Service Level - B'[B Value], 1)
VAR vClassC = SELECTEDVALUE('Input_Service Level - C'[C Value], 1)
VAR vAverage =
    AVERAGEX(
        Data_Master,
        VAR vRowClass = Data_Master[ABC_Class_Cost]
        RETURN
            SWITCH(
                vRowClass,
                "A", vClassA,
                "B", vClassB,
                "C", vClassC
            ) * 1
    )
RETURN
    vAverage
- Mark as New
- Bookmark
- Subscribe
- Mute
- Subscribe to RSS Feed
- Permalink
- Report Inappropriate Content
Hey @chutli ,
a calculated column is always static. After the file is loaded the values are not gonna change anymore.
So you have to solve that with a measure.
If you help me to understand a little better how the result should look like I can also help you.
- Mark as New
- Bookmark
- Subscribe
- Mute
- Subscribe to RSS Feed
- Permalink
- Report Inappropriate Content
- Mark as New
- Bookmark
- Subscribe
- Mute
- Subscribe to RSS Feed
- Permalink
- Report Inappropriate Content
Hey @chutli ,
that was a little trick, but try the following measure. I guess you have to adapt it to your tables:
ServiceLevel =
VAR vClassA = SELECTEDVALUE('Input_Service Level - A'[A Value], 1) -- Name of your Slicer table and column
VAR vClassB = SELECTEDVALUE('Input_Service Level - B'[B Value], 1)
VAR vClassC = SELECTEDVALUE('Input_Service Level - C'[C Value], 1)
VAR vAverage =
    AVERAGEX(
        Data_Master,
        VAR vRowClass = Data_Master[ABC_Class_Cost]
        RETURN
            SWITCH(
                vRowClass,
                "A", vClassA,
                "B", vClassB,
                "C", vClassC
            ) * 1
    )
RETURN
    vAverage
- Mark as New
- Bookmark
- Subscribe
- Mute
- Subscribe to RSS Feed
- Permalink
- Report Inappropriate Content
@selimovd Thank you for the effort, much appriciated it. unfortunately.. i think i need that to be a calculated column.
Because the Service level column also is used for other calcuations like Safety stock level.. and it's setting on each item level instead of any aggregated group level.
can you help me to brainstrome a bit if theres any work around?
Thank you.
- Mark as New
- Bookmark
- Subscribe
- Mute
- Subscribe to RSS Feed
- Permalink
- Report Inappropriate Content
oh never mind. i will just do measurea to all of them... that should works..
Helpful resources

Microsoft Fabric Learn Together
Covering the world! 9:00-10:30 AM Sydney, 4:00-5:30 PM CET (Paris/Berlin), 7:00-8:30 PM Mexico City

Power BI Monthly Update - April 2024
Check out the April 2024 Power BI update to learn about new features.

| User | Count |
|---|---|
| 114 | |
| 100 | |
| 83 | |
| 70 | |
| 61 |
| User | Count |
|---|---|
| 149 | |
| 114 | |
| 107 | |
| 89 | |
| 67 |


