Register now to learn Fabric in free live sessions led by the best Microsoft experts. From Apr 16 to May 9, in English and Spanish.
I am trying to transform an Excel worksheet containing a company's health insurance coverage for its employees. There are three tiers of coverage and four levels of each of those. I was able to transform the insurance dimension without any trouble, it looks like
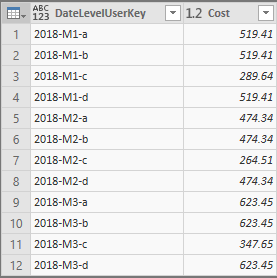
With M1, M2, M3 being the three tiers, and a, b, c, d representing who it applies to (Employee, Spouse, etc).
Below is a portion of the fact table,
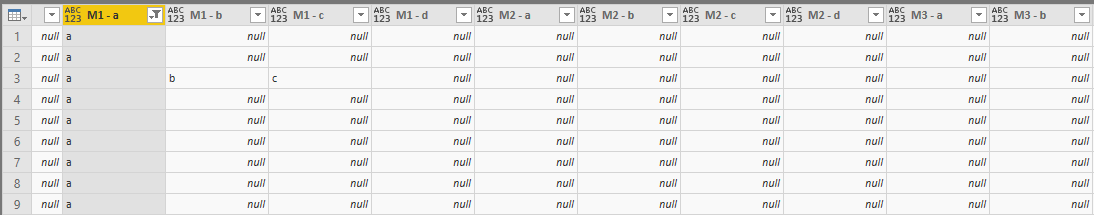
The rows are unique on Employee. As you can see, an employee can have multiple variations of insurance at once. I filtered out null values in M1 - a just to make things easier to visualize. I'm hoping to unpivot the M* - * columns into one long column, with multiple rows for employees that have multiple selections. I'm able to create the same type of key as in the dimension table, but I haven't been able to get them into one column. I have a feeling this involves the unpivot function but I have had no luck so far. Any help or advice is greatly appreciated.
Solved! Go to Solution.
I was able to solve this but I didn't end up using unpivot. I converted the values into the respective keys, then added a custom column = List.Union ( { {col_1}, {col_2}, ... , {col_n} } ) which I then expanded into new rows, giving me the desired result
Hi anjbauer1993,
I'm hoping to unpivot the M* - * columns into one long column, with multiple rows for employees that have multiple selections. I'm able to create the same type of key as in the dimension table, but I haven't been able to get them into one column.
To be general, in query editor, click on all columns named M*-*, click Transform-> Unpivot Columns and check if it can meet your reuquirement.
Regards,
Jimmy Tao
Hi,
Please show your exact expected result. Also, paste data here such that i can in turn paste that table into an Excel file.
Dimension:
DateLevelUserKey | Cost |
2018-M1-a | 519.41 |
2018-M1-b | 519.41 |
2018-M1-c | 289.64 |
2018-M1-d | 519.41 |
2018-M2-a | 474.34 |
2018-M2-b | 474.34 |
2018-M2-c | 264.51 |
2018-M2-d | 474.34 |
2018-M3-a | 623.45 |
2018-M3-b | 623.45 |
2018-M3-c | 347.65 |
2018-M3-d | 623.45 |
Fact Table:
Date | Last | First | M1 - a | M1 - b | M1 - c | M1 - d | M2 - a | M2 - b | M2 - c | M2 - d | M3 - a | M3 - b | M3 - c | M3 - d |
8/1/2018 | Doe | John | a | b | c | d | null | null | null | null | null | null | null | null |
8/1/2018 | Bauer | Andrew | a | null | null | null | null | null | null | null | null | null | null | null |
8/1/2018 | Dollin | Dustin | null | null | null | null | a | b | c | null | a | null | null | null |
And this is the result I am hoping for:
Date | Last | First | InsuranceKey |
8/1/2018 | Doe | John | 2018-M1-a |
8/2/2018 | Doe | John | 2018-M1-b |
8/3/2018 | Doe | John | 2018-M1-c |
8/4/2018 | Doe | John | 2018-M1-d |
8/1/2018 | Bauer | Andrew | 2018-M1-a |
8/1/2018 | Dollin | Dustin | 2018-M2-a |
8/2/2018 | Dollin | Dustin | 2018-M2-b |
8/3/2018 | Dollin | Dustin | 2018-M2-c |
Covering the world! 9:00-10:30 AM Sydney, 4:00-5:30 PM CET (Paris/Berlin), 7:00-8:30 PM Mexico City
Check out the April 2024 Power BI update to learn about new features.
User | Count |
---|---|
111 | |
100 | |
80 | |
64 | |
58 |
User | Count |
---|---|
146 | |
110 | |
93 | |
84 | |
67 |