- Power BI forums
- Updates
- News & Announcements
- Get Help with Power BI
- Desktop
- Service
- Report Server
- Power Query
- Mobile Apps
- Developer
- DAX Commands and Tips
- Custom Visuals Development Discussion
- Health and Life Sciences
- Power BI Spanish forums
- Translated Spanish Desktop
- Power Platform Integration - Better Together!
- Power Platform Integrations (Read-only)
- Power Platform and Dynamics 365 Integrations (Read-only)
- Training and Consulting
- Instructor Led Training
- Dashboard in a Day for Women, by Women
- Galleries
- Community Connections & How-To Videos
- COVID-19 Data Stories Gallery
- Themes Gallery
- Data Stories Gallery
- R Script Showcase
- Webinars and Video Gallery
- Quick Measures Gallery
- 2021 MSBizAppsSummit Gallery
- 2020 MSBizAppsSummit Gallery
- 2019 MSBizAppsSummit Gallery
- Events
- Ideas
- Custom Visuals Ideas
- Issues
- Issues
- Events
- Upcoming Events
- Community Blog
- Power BI Community Blog
- Custom Visuals Community Blog
- Community Support
- Community Accounts & Registration
- Using the Community
- Community Feedback
Register now to learn Fabric in free live sessions led by the best Microsoft experts. From Apr 16 to May 9, in English and Spanish.
- Power BI forums
- Forums
- Get Help with Power BI
- Desktop
- Re: Unknown value in histogram
- Subscribe to RSS Feed
- Mark Topic as New
- Mark Topic as Read
- Float this Topic for Current User
- Bookmark
- Subscribe
- Printer Friendly Page
- Mark as New
- Bookmark
- Subscribe
- Mute
- Subscribe to RSS Feed
- Permalink
- Report Inappropriate Content
Unknown value in histogram
Hello Microsoft Power BI Community.
I am developing a histogram in my project, with data starting at 6000 frequency. However, my histogram returns an unknown number 1. Below, print the data. can you help me? Remembering that the X and Y axes are automatic, and I am working with 20 bins. In other bins, the number 1 is also displayed.
Thank you!
Solved! Go to Solution.
- Mark as New
- Bookmark
- Subscribe
- Mute
- Subscribe to RSS Feed
- Permalink
- Report Inappropriate Content
@Anonymous
Frequency in “Histogram” usually count the frequency of “Values” in the visual. For example, frequency of “1-5” is 4 which counts the Sales, not the sum of “Whatever”. Reference here: https://en.wikipedia.org/wiki/Histogram
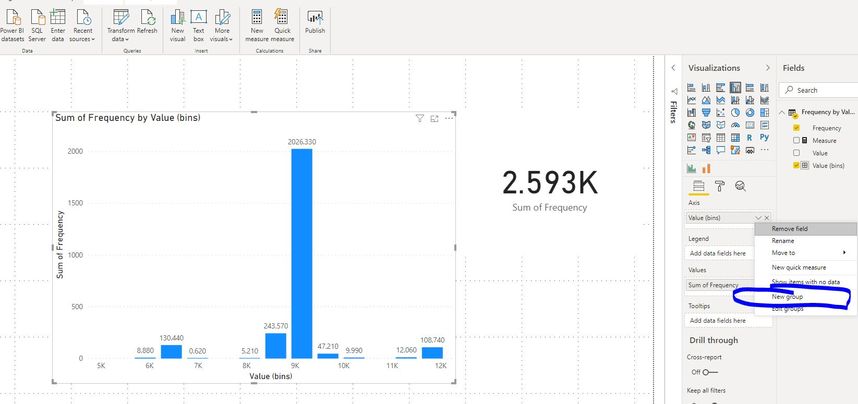
In this case, you may use a Clustered Column Chart with bins to categorize the “Value”. (Click New Group to create bins.)
Paul Zheng _ Community Support Team
If this post helps, then please consider Accept it as the solution to help the other members find it more quickly.
- Mark as New
- Bookmark
- Subscribe
- Mute
- Subscribe to RSS Feed
- Permalink
- Report Inappropriate Content
@Anonymous
I couldn't reproduce that issue like your screen, can you maybe share sample pbix. However, sometimes custom visuals that from Appsource experience unknown issues. Try reopen the pbix see if it occurs everytime.
Paul Zheng _ Community Support Team
If this post helps, then please consider Accept it as the solution to help the other members find it more quickly.
- Mark as New
- Bookmark
- Subscribe
- Mute
- Subscribe to RSS Feed
- Permalink
- Report Inappropriate Content
I shared the pbix file in my personal repository, follow the link below:
https://drive.google.com/file/d/1m3ZHjLG8eApvQRCI-Yiedox9ZYmuMEUF/view?usp=sharing
As shown below, when the values of 5.22k to 6.96k are selected, 140.48 is returned and its total sum is 139.32. This inconsistency is also realized by the graph in other values...
I would like you to help me to locate this error, or in something that may be correct to my data.
Thanks for the support!
- Mark as New
- Bookmark
- Subscribe
- Mute
- Subscribe to RSS Feed
- Permalink
- Report Inappropriate Content
@Anonymous
Frequency in “Histogram” usually count the frequency of “Values” in the visual. For example, frequency of “1-5” is 4 which counts the Sales, not the sum of “Whatever”. Reference here: https://en.wikipedia.org/wiki/Histogram
In this case, you may use a Clustered Column Chart with bins to categorize the “Value”. (Click New Group to create bins.)
Paul Zheng _ Community Support Team
If this post helps, then please consider Accept it as the solution to help the other members find it more quickly.
Helpful resources

Microsoft Fabric Learn Together
Covering the world! 9:00-10:30 AM Sydney, 4:00-5:30 PM CET (Paris/Berlin), 7:00-8:30 PM Mexico City

Power BI Monthly Update - April 2024
Check out the April 2024 Power BI update to learn about new features.

| User | Count |
|---|---|
| 110 | |
| 99 | |
| 80 | |
| 64 | |
| 58 |
| User | Count |
|---|---|
| 148 | |
| 111 | |
| 93 | |
| 84 | |
| 66 |


