- Power BI forums
- Updates
- News & Announcements
- Get Help with Power BI
- Desktop
- Service
- Report Server
- Power Query
- Mobile Apps
- Developer
- DAX Commands and Tips
- Custom Visuals Development Discussion
- Health and Life Sciences
- Power BI Spanish forums
- Translated Spanish Desktop
- Power Platform Integration - Better Together!
- Power Platform Integrations (Read-only)
- Power Platform and Dynamics 365 Integrations (Read-only)
- Training and Consulting
- Instructor Led Training
- Dashboard in a Day for Women, by Women
- Galleries
- Community Connections & How-To Videos
- COVID-19 Data Stories Gallery
- Themes Gallery
- Data Stories Gallery
- R Script Showcase
- Webinars and Video Gallery
- Quick Measures Gallery
- 2021 MSBizAppsSummit Gallery
- 2020 MSBizAppsSummit Gallery
- 2019 MSBizAppsSummit Gallery
- Events
- Ideas
- Custom Visuals Ideas
- Issues
- Issues
- Events
- Upcoming Events
- Community Blog
- Power BI Community Blog
- Custom Visuals Community Blog
- Community Support
- Community Accounts & Registration
- Using the Community
- Community Feedback
Register now to learn Fabric in free live sessions led by the best Microsoft experts. From Apr 16 to May 9, in English and Spanish.
- Power BI forums
- Forums
- Get Help with Power BI
- Desktop
- Re: Unique Counts by Hour
- Subscribe to RSS Feed
- Mark Topic as New
- Mark Topic as Read
- Float this Topic for Current User
- Bookmark
- Subscribe
- Printer Friendly Page
- Mark as New
- Bookmark
- Subscribe
- Mute
- Subscribe to RSS Feed
- Permalink
- Report Inappropriate Content
Unique Counts by Hour
Hi!
I'm trying to count the unique number of combinations between two columns by hour.
For example: I have data that looks like this:
I want to get the counts of unique pairings between Column 1 and Column 2 (simliar to below):
Any help appreciated!
Solved! Go to Solution.
- Mark as New
- Bookmark
- Subscribe
- Mute
- Subscribe to RSS Feed
- Permalink
- Report Inappropriate Content
First, check if the default summarization of the column hour is “Don’t summarize”:
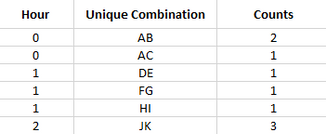
Then, create a new column for the Unique combination you want to count:
Unique Combination = CONCATENATE('Table'[Column1],'Table'[Column2])
So, create a measure Counts:
Counts = COUNT('Table'[Hour])Finnaly, you can create you a table to visualize your result:
If it helps, pls mark this post as a solution and give a kudo. Thanks
- Mark as New
- Bookmark
- Subscribe
- Mute
- Subscribe to RSS Feed
- Permalink
- Report Inappropriate Content
@mauriciosoterothis is very helpful!
There's one thing that I don't think is quite right.
I think the measure isn't working quite right?
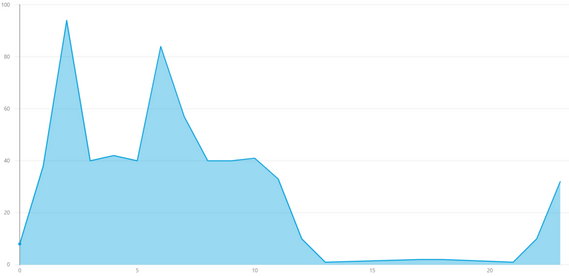
For example, when I plot:
Axis: HOUR
Values: Counts
When I plot:
Axis: HOUR
Values: Counts
Legend: Unique Combinations
I think it is related to this: https://community.powerbi.com/t5/Desktop/Stacked-line-chart-doesn-t-stack/td-p/52108
My boss WANTS a stacked area chart, so it would be great if I could get it to stack 🙂
- Mark as New
- Bookmark
- Subscribe
- Mute
- Subscribe to RSS Feed
- Permalink
- Report Inappropriate Content
Hi,
I think the problem is because the zero counts are not calculated, so it is not plotted. I made a calculated table, so the zeros could appear. It is what do you need? A plotted an area chart, I think it is better.
You can donwload the file in this link: Pbix file
If helps, I appreciate a kudo and mark as the solution.
- Mark as New
- Bookmark
- Subscribe
- Mute
- Subscribe to RSS Feed
- Permalink
- Report Inappropriate Content
Hi @Anonymous
= CALCULATE (COUNT(table[Hour],ALLEXCEPT(table,table[Column 1],table[Column 2]))
Then you could use concatenate to create a new column that combined the values.
Let me know if you have any questions.
If this solves your issues, please mark it as the solution, so that others can find it easily. Kudos are nice too.
Nathaniel
Did I answer your question? Mark my post as a solution!
Proud to be a Super User!
- Mark as New
- Bookmark
- Subscribe
- Mute
- Subscribe to RSS Feed
- Permalink
- Report Inappropriate Content
@Nathaniel_CThanks for the response.
I received:
Too many arguments were passed into the COUNT function. The maximum argument count for the function is 1.
- Mark as New
- Bookmark
- Subscribe
- Mute
- Subscribe to RSS Feed
- Permalink
- Report Inappropriate Content
Hi @Anonymous ,
Sorry dropped a paren after hour
Let me know if you have any questions.
If this solves your issues, please mark it as the solution, so that others can find it easily. Kudos are nice too.
Nathaniel
= CALCULATE (COUNT(table[Hour]),ALLEXCEPT(table,table[Column 1],table[Column 2]))
Did I answer your question? Mark my post as a solution!
Proud to be a Super User!
Helpful resources

Microsoft Fabric Learn Together
Covering the world! 9:00-10:30 AM Sydney, 4:00-5:30 PM CET (Paris/Berlin), 7:00-8:30 PM Mexico City

Power BI Monthly Update - April 2024
Check out the April 2024 Power BI update to learn about new features.

| User | Count |
|---|---|
| 107 | |
| 100 | |
| 80 | |
| 63 | |
| 58 |
| User | Count |
|---|---|
| 148 | |
| 111 | |
| 94 | |
| 84 | |
| 67 |


