Register now to learn Fabric in free live sessions led by the best Microsoft experts. From Apr 16 to May 9, in English and Spanish.
I have following dataset:
Year Location buyers Amount
2015 West A 12
2015 West A 14
2015 East Z 55
2015 South Y 62
2015 West O 24
2015 East B 10
2015 East B 12
2015 North B 23
2015 South K 10
2015 North C 23
2015 North M 23
Final output
if we chose top=3
West A 14
East Z 55
East Z 22
South Y 62
South K 10
North B 23
North C 23
North M 23
if top=1
West A 14
East Z 55
South Y 62
North B 23
i have to prepare a clustered bar chart that shows top n buyers for each region in terms of sum of amount they each bought (separately for each region).
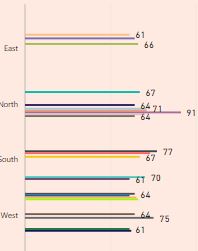
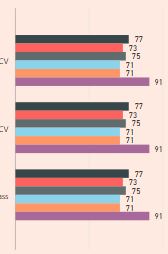
but in actual there should be no gaping like this
I have created a new measure
Measure 10 = CALCULATE (
[Measure for summation of amount],
KEEPFILTERS (
GENERATE (
VALUES ( Table1[region]),
TOPN ( 5, ALL ( Table1[buyer] ), [Measure for summation amount] )
)
)
)
Currently, Power BI Desktop will not automatically adjust the bar chart without gaping when Legend is added and there is no method to configure the gap width in bar chart. Some ideas about this issue have been submitted in the following links, please vote them up.
https://ideas.powerbi.com/forums/265200-power-bi-ideas/suggestions/16737364-allow-configurable-gap-w...
https://ideas.powerbi.com/forums/265200-power-bi-ideas/suggestions/16936663-add-size-gap-properties-...
https://ideas.powerbi.com/forums/265200-power-bi-ideas/suggestions/10094736-gap-width
Thanks,
Lydia Zhang
Covering the world! 9:00-10:30 AM Sydney, 4:00-5:30 PM CET (Paris/Berlin), 7:00-8:30 PM Mexico City
Check out the April 2024 Power BI update to learn about new features.
User | Count |
---|---|
110 | |
95 | |
76 | |
65 | |
51 |
User | Count |
---|---|
146 | |
109 | |
106 | |
88 | |
61 |